Percentage change measures how much a value has increased or decreased relative to its starting point, expressed as a percentage. Formally defined as the relative difference between an old value and a new value, it tells you not just that something changed, but how much it changed proportionally. A positive result means an increase; a negative result means a decrease.
The formula is straightforward:
Percentage Change = ((New Value − Original Value) ÷ Original Value) × 100
A positive result signals growth. A negative result signals a decline. The original value always sits in the denominator.
You can also write it as: ((New Value ÷ Original Value) − 1) × 100. Both versions produce the same proportional result. The key is always anchoring the calculation to the original value, not the new one. Using the new value as the denominator shifts the metric entirely and gives you a distorted picture.
Percentage change standardizes comparisons across very different quantities, whether you are comparing a $5 stock move against a $500,000 home price shift or tracking population growth across countries of different sizes. That standardization is what makes it so widely used across finance, economics, and everyday analysis.
Table of Contents
- How to calculate percentage change, step by step
- Practical examples of percentage change across different contexts
- Where percentage change shows up in the real world
- Practice problems: test your understanding
- Key Takeaways
- See percentage change in action on live market data
How to calculate percentage change, step by step
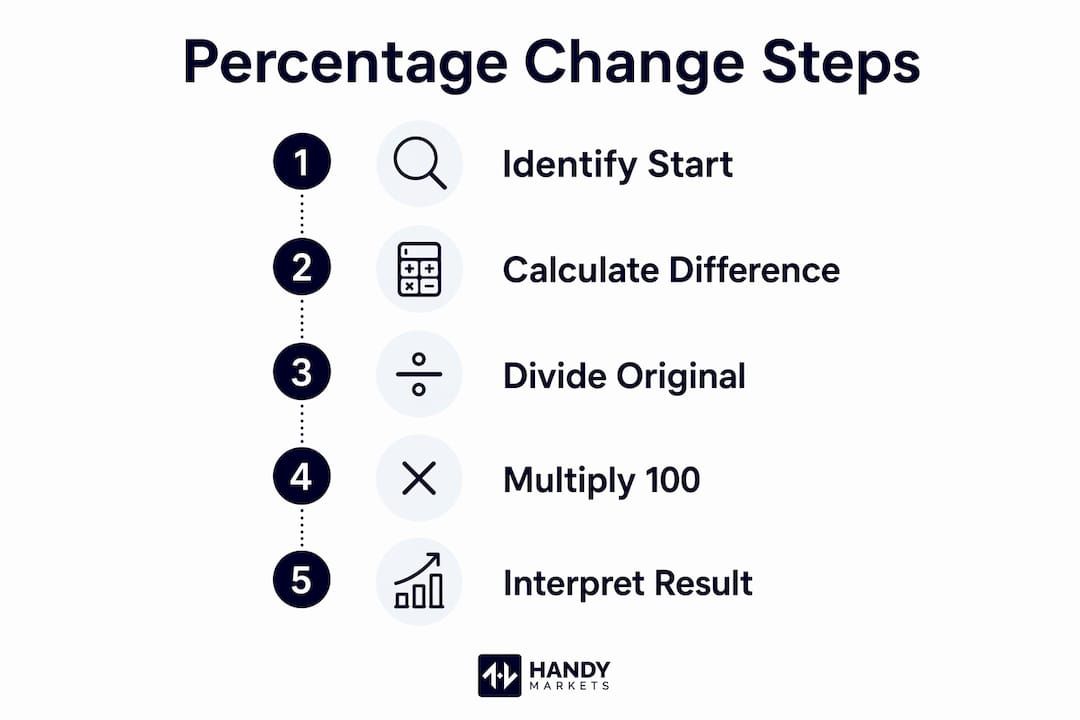
The calculation breaks into three clean steps, and once you run through it a few times, it becomes second nature.
- Find the difference. Subtract the original value from the new value: New Value − Original Value. If the result is positive, the value went up. If negative, it went down.
- Divide by the original value. Take that difference and divide it by the original (starting) value. The denominator must always be the original value to measure the relative shift accurately.
- Multiply by 100. Convert the decimal to a percentage by multiplying by 100.
Worked example: A textbook costs $40 one semester and $52 the next.
- Difference: $52 − $40 = $12
- Divide by original: $12 ÷ $40 = 0.30
- Multiply by 100: 0.30 × 100 = +30%
The price increased by 30%. If the price had dropped from $40 to $34 instead, the result would be ($34 − $40) ÷ $40 × 100 = −15%, a 15% decrease.
Common mistake to avoid: Dividing by the new value instead of the original. If you divided $12 by $52 in the example above, you would get roughly 23%, not 30%. That is a meaningfully different answer, and it is wrong for standard percentage change analysis.

Pro Tip: Always ask yourself, “What was the starting point?” before you plug numbers into the formula. The original value is your anchor. Getting that wrong is the single most common calculation error.
Practical examples of percentage change across different contexts
Seeing the formula in action across varied scenarios builds real confidence. Here are several worked examples drawn from finance, everyday life, and data analysis.
Stock price movement
| Scenario | Original Value | New Value | Change | Percentage Change |
|---|---|---|---|---|
| Stock A | $80 | $100 | +$20 | +25% |
| Stock B | $200 | — | −$40 | −20% |
| Savings account | — | — | +$50 | +5% |

Stock A gained 25%, while Stock B lost 20%. Notice that a $40 drop on a $200 stock and a $20 gain on an $80 stock feel similar in dollar terms but tell very different stories in percentage terms.
Population growth
In 2010, a city had 4.8 million residents. By 2015, that figure reached 5.2 million. Using the Eurostat formula: ((5.2 ÷ 4.8) − 1) × 100 = +8.3% growth over five years.
The asymmetry trap: why a 20% gain does not cancel a 20% loss
This one surprises most students. Applying the same percentage increase then decrease does not return you to the original value, because the two calculations use different base numbers.
- Start with $100. Gain 20%: $100 × 1.20 = $120.
- Lose 20% from $120: $120 × 0.80 = $96, not $100.
You end up 4% below where you started. To reverse a percentage change correctly, you divide by (1 + the decimal change) for an increase, or by (1 − the decimal change) for a decrease.
Percentage change vs. percentage points
This distinction trips up students and professionals alike. Eurostat flags it as one of the most common sources of confusion in statistical reporting.
- An interest rate rises from 4% to 6%. That is a 2 percentage point increase (absolute difference).
- It is also a 50% change (relative change: 2 ÷ 4 × 100).
Both statements are correct. They just answer different questions. Percentage points describe the raw arithmetic gap between two rates. Percentage change describes how large that gap is relative to the starting rate.
Where percentage change shows up in the real world
Percentage change is one of those tools that quietly powers analysis across almost every field. It is widely applied in finance, real estate, currency exchange, and statistics to compare performance over time.
In finance and investing, every stock quote you see on a market data platform displays a percentage change alongside the price. That number tells you instantly whether a stock is up or down relative to its previous close, and by how much. Tracking portfolio performance over time relies on the same calculation, applied across multiple assets and time horizons.
In economics, percentage change is the backbone of time series analysis. The U.S. Bureau of Labor Statistics uses it to report Consumer Price Index changes, unemployment rate shifts, and wage growth, all expressed as percentage changes to make comparisons across different periods and regions meaningful.
In statistics and quality control, relative change measurements serve as a gauge for consistency between repeated measurements. When a lab runs the same test twice and compares results, percentage change quantifies how far apart the outcomes are in relative terms.
In everyday life, retail discounts, grade improvements, and utility bill fluctuations all use the same underlying math. A shirt marked down from $60 to $45 dropped by 25%. A student who raised a test score from 70 to 84 improved by 20%.
Practice problems: test your understanding
Work through these problems on your own before checking the solutions. Each one builds a slightly different skill.
Problems:
- A car was priced at $25,000 last year. This year it costs $27,500. What is the percentage change?
- A company’s revenue fell from $8 million to $6.4 million. What is the percentage change?
- A runner’s best mile time dropped from 8 minutes to 8 minutes. What is the percentage change?
- An apartment’s rent rose from $1,200 to $1,380. What is the percentage change?
Solutions:
- ($27,500 − $25,000) ÷ $25,000 × 100 = $2,500 ÷ $25,000 × 100 = +10% increase.
- ($6,400,000 − $8,000,000) ÷ $8,000,000 × 100 = −$1,600,000 ÷ $8,000,000 × 100 = −20% decrease.
- (8 − 8) ÷ 8 × 100 = 0 ÷ 8 × 100 = 0%. No change at all. Zero is a perfectly valid result.
- ($1,380 − $1,200) ÷ $1,200 × 100 = $180 ÷ $1,200 × 100 = +15% increase.
Pro Tip: After you calculate, do a quick sanity check. If the new value is higher than the original, your answer should be positive. If lower, negative. A sign error is the fastest way to misread a result.
- A result of 0% means the value held steady, which is itself useful information.
- Large percentage changes on small base values can look dramatic but represent modest absolute shifts. Always consider both the percentage and the underlying numbers together.
- When you track percentage changes in markets over time, consistent methodology matters more than any single data point.
Key Takeaways
Percentage change measures relative difference by dividing the change in value by the original value and multiplying by 100, with positive results indicating growth and negative results indicating decline.
| Point | Details |
|---|---|
| Core formula | ((New Value − Original Value) ÷ Original Value) × 100 gives the relative shift. |
| Denominator matters | Always divide by the original value; using the new value produces a different, incorrect metric. |
| Asymmetry of gains and losses | A 20% gain followed by a 20% loss does not return to the starting value due to different base numbers. |
| Percentage points vs. percentage change | Percentage points measure absolute difference between two rates; percentage change measures relative difference. |
| Broad applications | Finance, economics, quality control, and everyday comparisons all rely on percentage change to standardize data. |
See percentage change in action on live market data
Understanding the formula is one thing. Watching it work on real assets is where it clicks. Handy Markets tracks live stock quotes and percentage changes across equities, ETFs, crypto, forex, and commodities in one place, so you can see exactly how prices shift in real time. You can also set instant price alerts across Telegram, Discord, Slack, SMS, and email, so you never miss a move that matters to you.