TL;DR:
- Percentage change measures asset movement relative to its starting value, enabling fair comparisons.
- The formula is ((New Value - Old Value) / Old Value) x 100, used to assess gains or losses.
- Correct application and awareness of common errors are vital for accurate market analysis and decision-making.
Most traders glance at a price and feel confident they understand what a market move means. But misreading percentage change, even slightly, can send you in the wrong direction on a trade. A stock dropping from $100 to $80 looks identical in raw dollar terms to a $100 drop from a $500 asset, yet the percentage difference is enormous. Across crypto, stocks, and commodities, that gap between perception and reality costs real money. This guide gives you clear definitions, a reliable formula, worked examples, common errors to avoid, and a practical framework so you can apply percentage change with confidence every time you open a chart.
Table of Contents
- What is percentage change in markets?
- How to calculate percentage change: The formula and examples
- Common mistakes in percentage change calculations
- Making percentage change actionable: Practical market use cases
- Why percentage change is the real north star for traders
- Take the next step: Track percentage change effortlessly
- Frequently asked questions
Key Takeaways
| Point | Details |
|---|---|
| Universal metric | Percentage change enables clear comparison of market moves across all assets. |
| Simple calculation | Use one easy formula to determine gains or losses on any investment. |
| Actionable insights | Knowing percentage change supports real trading decisions, alerts, and risk control. |
| Error awareness | Avoiding common calculation mistakes is crucial to accurate market analysis. |
What is percentage change in markets?
At its core, percentage change measures how much an asset’s price has moved relative to where it started. It expresses the shift as a proportion of the original value, which makes it far more meaningful than a raw dollar or point movement. If Bitcoin rises by $2,000, that number tells you very little without context. Was the starting price $5,000 or $50,000? The percentage change answers that question instantly.
This is precisely why traders prefer percentage change over absolute price moves. A 40% surge in a $0.50 altcoin and a 40% surge in a $3,000 stock tell you something directly comparable: both assets doubled in relative value. Absolute numbers, by contrast, are almost impossible to compare fairly across assets with wildly different price points.
Percentage change quantifies relative price movement across assets and markets, making it the universal language traders use to benchmark performance regardless of asset class.
“Percentage change is the financial translator that converts the noise of different-priced assets into a single, readable signal.”
This matters across every major market. Here is where you will rely on percentage change most often:
- Cryptocurrencies: Crypto markets run 24/7, and market fluctuations explained show that daily swings of 5% to 15% are routine. Percentage change tells you whether a move is meaningful or just noise.
- Stocks: Earnings releases, Fed announcements, and sector rotations can shift stock prices dramatically. Percentage change helps you compare a $5 move in a $10 stock versus a $5 move in a $500 stock.
- Commodities: Oil, gold, and agricultural goods fluctuate based on supply shocks and geopolitical events. Expressing those moves in percentage terms lets you rank them by true magnitude.
- Portfolio tracking: When you hold positions across multiple asset classes, percentage change is the only fair way to evaluate which holdings are actually performing.
- Risk assessment: Setting stop-loss levels at a percentage threshold rather than a dollar amount keeps your risk proportional no matter what price level the asset trades at.
Think of percentage change as the heartbeat monitor of your portfolio. Whether the patient is a penny stock or a high-priced futures contract, the same scale applies.
How to calculate percentage change: The formula and examples
The formula is simple, and once it becomes second nature, you will use it constantly. Here it is:
Percentage Change = ((New Value - Old Value) / Old Value) x 100
That is the entire calculation. A positive result means a gain; a negative result means a loss. Let us walk through it step by step.
Step-by-step calculation:
- Identify the old value (the starting or earlier price).
- Identify the new value (the current or later price).
- Subtract the old value from the new value to find the absolute change.
- Divide that result by the old value.
- Multiply by 100 to convert to a percentage.
Now, let us apply this to three real-world scenarios:
Example 1, Cryptocurrency: Ethereum was priced at $1,800 last month and trades at $2,430 today. The calculation: ((2,430 - 1,800) / 1,800) x 100 = 35%. Ethereum gained 35%.
Example 2, Stocks: A tech stock opened at $240 and closed at $204. The calculation: ((204 - 240) / 240) x 100 = -15%. The stock dropped 15%.

Example 3, Commodities: Gold moved from $1,950 per ounce to $2,067. The calculation: ((2,067 - 1,950) / 1,950) x 100 = 6%. Gold rose approximately 6%.
| Asset | Old value | New value | Percentage change |
|---|---|---|---|
| Ethereum (crypto) | $1,800 | $2,430 | +35% |
| Tech stock | $240 | $204 | -15% |
| Gold (commodity) | $1,950 | $2,067 | +6% |
Correct calculation ensures accurate assessment of investment performance, which is why disciplined traders check this number before acting. You can also track stock values in real time to feed accurate data into your calculations without manual lookups.
Pro Tip: Always double-check your base value (old value) before running the formula. Using the wrong starting price is the single most common source of calculation errors, and it can flip a gain into an apparent loss or vice versa.
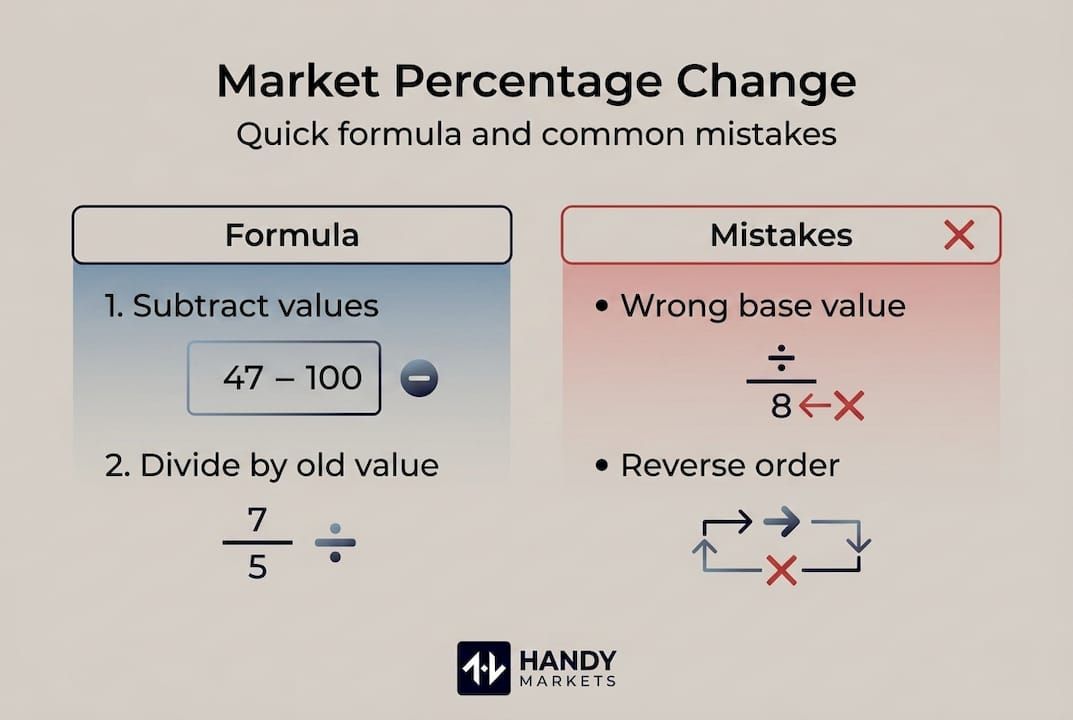
Common mistakes in percentage change calculations
Getting the formula right is only half the battle. The other half is making sure you apply it correctly every time. Calculation errors often mislead investors, impacting trading strategies in ways that are hard to detect until real money is lost.
Here are the most frequent mistakes traders make:
- Reversing old and new values: Dividing by the new value instead of the old one gives you a completely different number and can reverse the apparent direction of a move.
- Confusing absolute change with percentage change: A $50 price drop sounds dramatic. But if the asset started at $2,000, that is only a 2.5% decline. Treating $50 as meaningful in isolation leads to disproportionate reactions.
- Ignoring direction (gain vs. loss): Percentage change must include its sign. Dropping that negative sign when an asset falls can make a losing position look like a winner on paper.
- Using split-adjusted or dividend-adjusted prices incorrectly: Stock prices are sometimes adjusted for splits or dividends, and mixing adjusted with unadjusted prices in the same formula produces meaningless results.
- Compounding errors across time periods: Adding daily percentage changes together does not give you the correct total return for the period. You need to use the original starting value for any multi-period comparison.
The order of values is especially critical. Percentage change is not symmetric. A 50% drop followed by a 50% gain does not return you to zero. You end up 25% below your starting point. That counter-intuitive math trips up even experienced traders who rely on rough estimates.
Pro Tip: Always use the actual chronological order: old value first, new value second. Write it out before you calculate if there is any doubt.
For a deeper look at how these errors affect strategy, the fluctuation analysis tips at Handy.Markets walk through real cases. You can also review a market volatility checklist designed for active traders, or compare financial markets side by side to see how percentage change varies across asset classes in practice.
Making percentage change actionable: Practical market use cases
Knowing the formula is valuable. Knowing when and how to act on it is what separates traders who grow their portfolios from those who spin their wheels. Practical application of percentage change spans across key financial instruments like stocks, forex, and crypto, and it touches nearly every decision a trader makes.
Here is a realistic snapshot of how percentage change informs trading actions:
| Asset | Price before | Price after | Percentage change | Suggested action |
|---|---|---|---|---|
| Bitcoin (BTC) | $42,000 | $50,400 | +20% | Review position size, consider partial profit taking |
| S&P 500 ETF | $480 | $456 | -5% | Assess stop-loss levels, check overall portfolio exposure |
| Crude oil | $78 | $85.8 | +10% | Monitor energy sector exposure, potential rebalancing |
| EUR/USD forex | 1.0800 | 1.0530 | -2.5% | Evaluate currency hedges or adjust forex allocation |
Percentage change directly supports three core decisions every trader faces. First, buy signals: when an asset pulls back by a meaningful percentage from a recent high, percentage thresholds help you identify potential entry points without chasing price. Second, sell or reduce signals: a sudden surge of 15% to 20% in a short timeframe often warrants profit taking or a tighter stop, and percentage change makes that trigger objective rather than emotional. Third, hold decisions: gradual moves within a normal range (say, 1% to 3%) usually require no action, which is valuable information too.
For cryptocurrency traders especially, price alerts tied to percentage thresholds are essential. Setting an alert that fires when Bitcoin moves 5% in either direction within a trading session gives you a structured way to respond rather than react. You can track market changes across dozens of assets simultaneously without watching every screen.
Portfolio rebalancing also leans heavily on percentage change. If one asset rises 30% while your overall portfolio grows 10%, that position now represents a larger share of your holdings than intended. Percentage change gives you the objective trigger to bring it back into alignment. You can explore financial markets for all asset classes in one place to make that rebalancing process faster and more accurate.
Why percentage change is the real north star for traders
Financial news headlines love big dollar numbers. “Stock loses $10 billion in market cap” or “Bitcoin drops $3,000” sounds dramatic, but those figures are almost useless for a trader trying to evaluate actual performance. The real question is always: relative to what?
We believe percentage change is systematically undervalued in everyday trading conversations, and that obsession with raw price moves is one of the quieter reasons traders make inconsistent decisions.
“Percentage change lets you compare apples to apples. Without it, you are comparing apples to aircraft carriers.”
Seasons traders know this instinctively. They do not ask “how many dollars did this move?” They ask “what percentage of capital is at risk, and what percentage gain justifies it?” That mental shift changes everything about how you size positions, set stops, and evaluate your overall results.
Advanced market analysis consistently uses percentage-based frameworks for exactly this reason. Percentage change levels the playing field, making a microcap stock’s 8% move directly comparable to a blue-chip stock’s 8% move. Same heartbeat. Different patients. Same diagnostic value.
If you train yourself to think in percentages first and dollars second, your trading decisions become more consistent, more rational, and much easier to review after the fact.
Take the next step: Track percentage change effortlessly
Understanding the formula is your foundation. But keeping up with percentage changes across dozens of assets in real time is where most traders struggle. That is where Handy.Markets makes a measurable difference.
With Handy.Markets, you can set price alerts based on percentage thresholds across crypto, stocks, commodities, and forex, delivered directly to Telegram, Discord, Slack, SMS, or email. You never have to manually calculate and monitor every position. Track crypto price alerts for fast-moving coins, or keep an eye on track multiple markets from one clean dashboard. Smarter monitoring means faster, more confident decisions without the noise.
FAQ
Why is percentage change used in markets instead of dollar change?
Percentage change offers comparability for assets of different prices and scales, so a 10% move in a $5 stock means the same thing proportionally as a 10% move in a $500 stock. Dollar change cannot provide that context.
What is the formula for calculating percentage change in an asset’s price?
The standard formula for percentage change is: ((New Value - Old Value) / Old Value) x 100. A positive result indicates a gain, and a negative result indicates a loss.
How can I avoid mistakes when calculating percentage change?
Always use the oldest price as your starting value and place the new price in the numerator. Proper order and accuracy prevent the most common errors that skew financial analysis.
Can percentage change be used to track losses as well as gains?
Yes. Percentage change tracks both upward and downward movements. When the new value is lower than the old value, the result is negative, clearly indicating a decline in price.