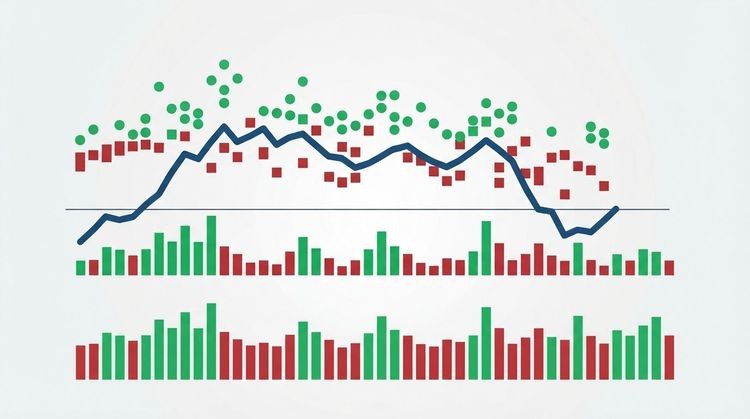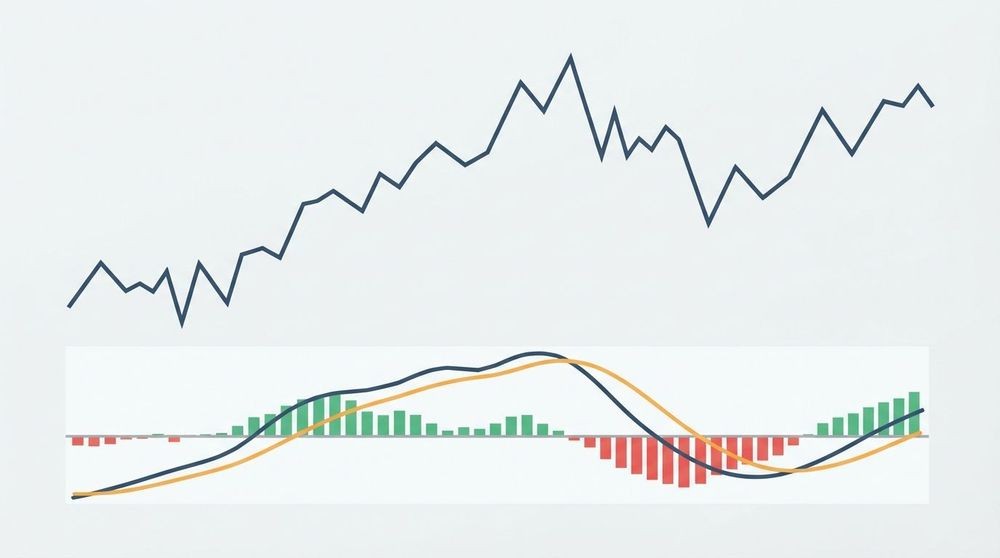
The Moving Average Convergence Divergence (MACD) is a momentum oscillator that measures the difference between a stock’s 12-period and 26-period exponential moving averages (EMAs). For stocks, it tells you whether momentum is building or fading, and in which direction. The standard 12-26-9 setting works as a reliable baseline for most traders: 12 and 26 periods define the MACD line, while 9 periods smooth it into the signal line. If you want to confirm a trend, time an entry, or spot a momentum shift before price fully commits, MACD is one of the most practical tools available.
Key Takeaways
MACD is most effective when used as a momentum confirmation tool within a trend, not as a standalone buy/sell signal generator.
| Point | Details |
|---|---|
| Standard formula | MACD = 12-period EMA minus 26-period EMA; signal line = 9-period EMA of MACD. |
| Best-use conditions | Highest reliability in trending markets; avoid crossover signals when ADX is below 20. |
| Top signals to use | Zero-line crossovers and histogram reversals offer earlier, higher-quality entries than raw crossovers alone. |
| Confirm before acting | Crossovers alone have a limited standalone accuracy rate and perform better when combined with RSI, ADX, or volume confirmation. |
| Handy Markets | Use Handy Markets price alerts to monitor MACD-level price events across stocks and ETFs without constant screen-watching. |
Table of Contents
- What is MACD in stock analysis, and how is it calculated?
- What are the key MACD trading signals you should know?
- How to use MACD on stocks: entries, exits, and risk rules
- When should you change MACD settings from the default 12-26-9?
- What are the biggest limitations of MACD you need to avoid?
- Annotated examples: reading MACD signals on stock charts
- How to monitor MACD live using Handy Markets alerts
- What actually works with MACD: an editorial perspective
- Handy Markets: real-time data and alerts for MACD traders
- Sources
What is MACD in stock analysis, and how is it calculated?
MACD is built from three components, each telling a slightly different part of the momentum story. Understanding them mechanically makes the signals far easier to read in real time.
The three components:
- MACD line: The core reading. Calculated as the 12-period EMA minus the 26-period EMA. When it rises, short-term momentum is outpacing longer-term momentum.
- Signal line: A 9-period EMA of the MACD line itself. It smooths out noise and acts as a trigger for crossover signals.
- Histogram: The visual bar chart showing the distance between the MACD line and the signal line. Tall bars mean momentum is strong; shrinking bars suggest it is fading.
As Investopedia explains, the formula is straightforward:
How the indicator is computed, step by step:
- Calculate the 12-period EMA of closing prices.
- Calculate the 26-period EMA of closing prices.
- Subtract the 26-period EMA from the 12-period EMA to get the MACD line.
- Calculate the 9-period EMA of the MACD line to get the signal line.
- Subtract the signal line from the MACD line to produce the histogram value for each bar.
The reason EMAs create a momentum measure rather than a price level is subtle but important. EMAs weight recent prices more heavily than older ones, so when the shorter EMA pulls away from the longer EMA, it reflects accelerating buying or selling pressure. MACD does not tell you where price is; it tells you how fast it is moving and whether that speed is increasing or decreasing. That distinction is what makes it useful for timing entries rather than just identifying a trend that already exists.
Interactive Brokers’ trading education describes MACD as a trend-following momentum indicator, which captures both of its roles: it follows the trend’s direction and measures the energy behind it.
What are the key MACD trading signals you should know?
Every MACD signal falls into one of four categories. Each one carries a different level of reliability and a different timing implication.
- MACD/Signal line crossover: When the MACD line crosses above the signal line, it is a bullish signal. When it crosses below, bearish. These are the most commonly watched signals, but Fidelity’s technical analysis guide notes they are more reliable when the crossover happens above the zero line (bullish) or below it (bearish), aligning with the prevailing trend.
- Zero-line cross: When the MACD line crosses above zero, the 12-period EMA has moved above the 26-period EMA, confirming a bullish shift in momentum. A cross below zero confirms the opposite. These signals are slower than crossovers but carry more weight as trend confirmation tools, which is why swing traders often use them as a filter before acting on a crossover.
- Histogram peaks and shrinking bars: The histogram does not just show direction; it shows acceleration. When bars grow taller, momentum is strengthening. When they shrink, momentum is decelerating, even if price is still moving in the same direction. TradeAlgo’s MACD guide makes the key distinction: the histogram measures momentum acceleration, not direction. A stock can still be rising while the histogram is shrinking, which is an early warning worth heeding.
- Bullish and bearish divergences: A bullish divergence occurs when price makes a lower low but MACD makes a higher low, suggesting that selling momentum is weakening. A bearish divergence is the reverse: price makes a higher high while MACD makes a lower high, hinting that the rally is losing steam. Divergences tend to be higher-probability signals when they form at significant support or resistance levels.
Pro Tip: Watch the histogram before the crossover happens. When bars start shrinking toward zero, momentum is already decelerating. Entering on a histogram reversal gives you an earlier position than waiting for the line crossover, which often fires several bars after the real shift.
Quick micro-examples:
- Crossover above zero: A stock in an uptrend pulls back slightly, then the MACD line crosses above the signal line while both lines sit above zero. Price resumes its upward move within one to three bars.
- Bearish divergence: A stock reaches a new 52-week high, but the MACD histogram peak is lower than the previous peak. The stock reverses within the following week.
How to use MACD on stocks: entries, exits, and risk rules
Signals are only useful when they connect to a repeatable process. Here is a practical framework for turning MACD readings into actual trade decisions.
Step-by-step entry and exit process:
- Confirm the trend direction first. Before acting on any MACD signal, check whether price is above or below a key moving average (such as the 50-day or 200-day MA). Only take long signals when price is in an uptrend, and short signals in a downtrend.
- Wait for a bullish MACD crossover above the zero line. A crossover that happens while both lines are above zero is a higher-quality long entry than one below zero.
- Check for price confirmation. Look for the stock to be near a support level, bouncing off a trendline, or breaking a short-term resistance level on volume.
- Enter on the close of the crossover bar or on the open of the next bar if you want to avoid late-day volatility.
- Set your stop below the most recent swing low. This keeps your risk defined and prevents a minor pullback from stopping you out of a valid trade.
- Exit when the MACD line crosses back below the signal line, or when the histogram shrinks to near zero and reverses, whichever comes first.
For a broader view of how to layer MACD into a full step-by-step market analysis process, combining it with price action and other indicators strengthens every decision.
Timeframe and settings guidance:
| Trading Style | Chart Interval | MACD Settings | Rationale |
|---|---|---|---|
| Swing trading | Daily | 12-26-9 (default) | Balances signal frequency and reliability for multi-day holds |
| Position trading | Weekly | 12-26-9 or 8-17-9 | Slower signals reduce noise on longer timeframes |
| Intraday (day trading) | 5-min | 6-13-5 or 5-13-1 | Faster EMAs respond quicker; expect more whipsaw |
Risk management checklist before entering a trade:
- Is the trend direction confirmed by a longer-period moving average?
- Is the MACD crossover happening above (long) or below (short) the zero line?
- Is there a clear stop level no more than 2–3% below entry?
- Does position size keep total risk below 1–2% of account capital?
- Is there a defined exit trigger (MACD re-cross or histogram reversal)?
Avoiding common beginner trading mistakes often comes down to having this kind of checklist before every trade, not after a loss.
When should you change MACD settings from the default 12-26-9?
Most traders should start with 12-26-9 and have a specific reason before changing it. Here is how to think about the tradeoffs.
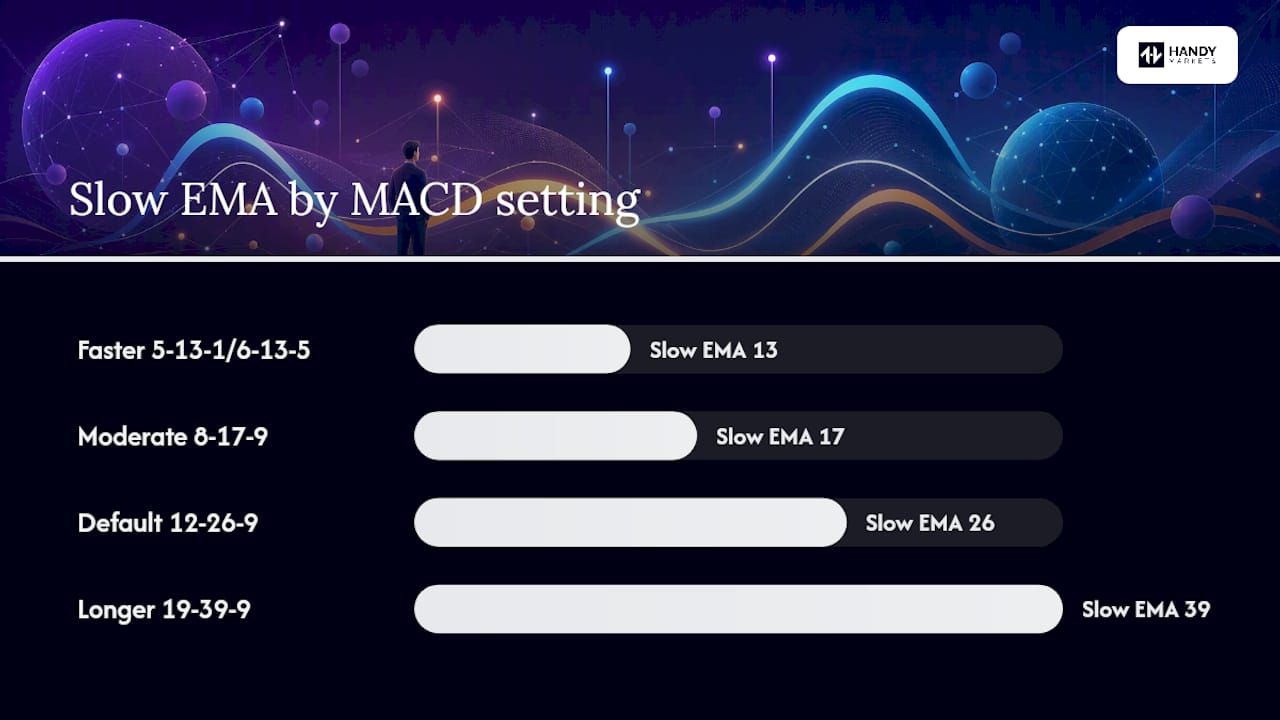
- Default 12-26-9: Works across most markets and timeframes. The reason many professionals stick with it is cross-market consistency: when you switch between stocks, ETFs, and indices, the same settings give you comparable readings. TradingSim’s MACD guide confirms that 12-26-9 is standard on most platforms and remains the most widely used baseline.
- 5-13-1 or 6-13-5 (faster settings): Shortening the EMAs makes the indicator more responsive, which suits intraday traders who need signals within minutes rather than days. The tradeoff is more whipsaw: the MACD line crosses the signal line more often, and many of those crosses are noise rather than signal.
- 8-17-9 (moderate adjustment): A middle ground that some swing traders use on volatile stocks. It responds faster than the default without the extreme noise of the shortest settings.
- Longer settings (e.g., 19-39-9): Slower signals that suit position traders on weekly charts. Fewer crossovers, but each one carries more weight.
Rules of thumb for adapting settings:
- On high-volatility stocks, consider lengthening the slow EMA slightly to filter out noise.
- On low-volatility or slow-moving stocks, the default 12-26-9 usually works without adjustment.
- Never change settings based on a single trade outcome. Validate any nonstandard setting on at least 50–100 historical daily bars before using it live.
The backtest process is straightforward: pull up a stock’s daily chart, apply your modified MACD settings, and manually count how many crossovers led to profitable moves versus false signals. Compare that ratio to the default settings on the same chart. If the improvement is marginal, keep the default.
For context on which indicators pair well with MACD across different market conditions, the stock market indicators overview at Handy Markets covers RSI, ADX, and moving averages in practical terms.
What are the biggest limitations of MACD you need to avoid?
MACD is a powerful tool, but it has predictable failure modes. Knowing them in advance saves you from the most common and costly mistakes.
- Lagging nature: MACD is built on EMAs, which are inherently backward-looking. By the time a crossover fires, a meaningful portion of the move may already be priced in. Mitigation: use the histogram for earlier entries, and treat crossovers as confirmation rather than the primary trigger.
- Whipsaw in choppy markets: When a stock trades sideways without a clear trend, MACD crosses the signal line repeatedly with no follow-through. Fidelity recommends confirming MACD signals with trend measures to avoid this. A simple rule: if the ADX reading is below 20, the market is likely range-bound, and MACD crossovers carry far less weight.
- Over-reliance on crossovers alone: Crossovers without context are weak signals. TradeAlgo’s analysis notes that crossovers alone hit roughly 45–55% accuracy, improving materially when combined with RSI, ADX, or volume confirmation. That is barely better than a coin flip without confirmation.
- Misreading the histogram: Tall histogram bars do not mean “buy more.” They mean momentum is strong at that moment. Traders who chase entries when the histogram is at its peak often buy just as momentum starts to fade.
- Using MACD as an overbought/oversold signal: Unlike RSI, MACD has no fixed upper or lower boundary. A MACD line that looks “high” on one stock may be perfectly normal for another. Never use MACD absolute values to judge whether a stock is overbought.
One operational rule that reduces false signals significantly: require at least one confirming factor before acting on any MACD crossover. That factor can be a trend filter (price above the 200-day MA), a volume spike on the crossover bar, or an RSI reading that aligns with the direction of the trade. For a broader look at how to construct buy and sell signal rules with confirmation logic, the principle is the same across asset classes.
Annotated examples: reading MACD signals on stock charts
These three walkthroughs cover the most common setups you will encounter. Each one follows the same structure: signal sequence, price chart confirmation, and the lesson it teaches.
Note: annotated chart screenshots should be added to the published version of this article to accompany each walkthrough below.
Walkthrough 1: Trend-following re-entry
- Signal sequence: Stock is in a clear uptrend above its 50-day MA. MACD pulls back toward the zero line during a price consolidation, then the MACD line crosses back above the signal line while both remain above zero.
- Price confirmation: The stock holds a prior support level and closes above a short-term resistance on the crossover day.
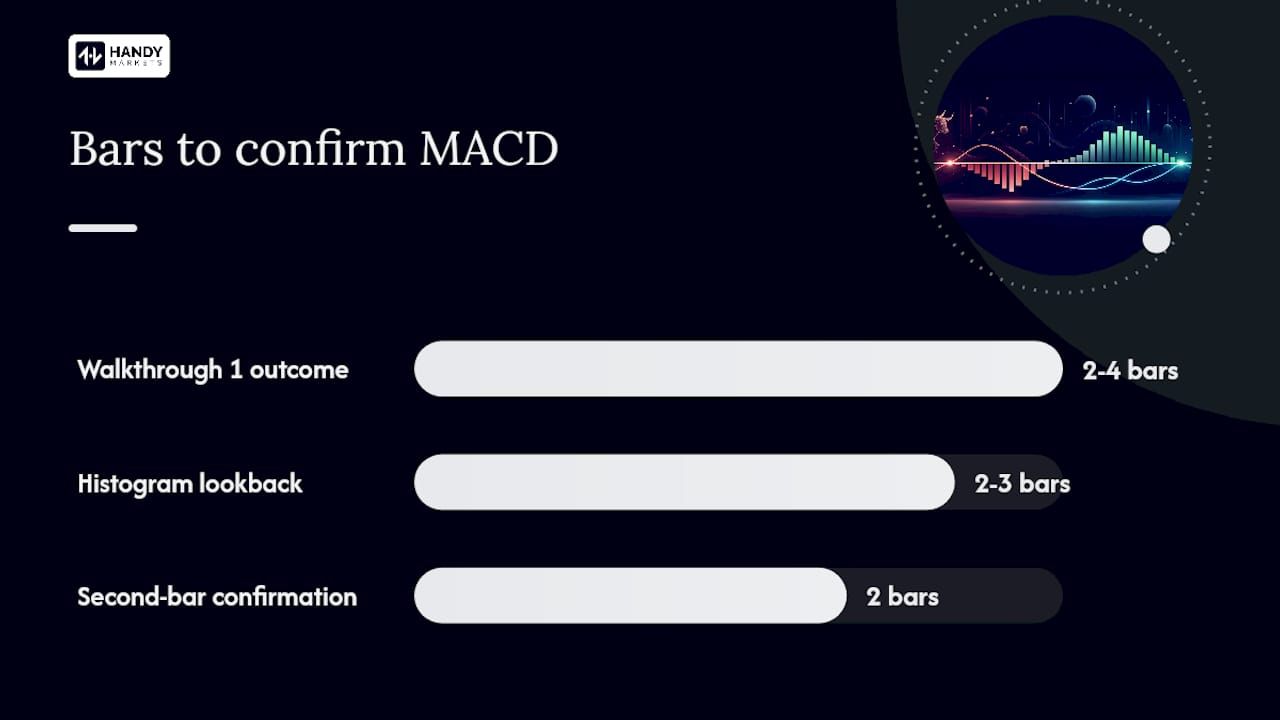
- Outcome: Price resumes the uptrend within two to four bars. The lesson here is that re-entry signals during a pullback in an established trend are among the highest-probability MACD setups.
Walkthrough 2: Bearish divergence spotting
- Signal sequence: Stock makes a new price high. The MACD histogram peak on this second high is lower than the histogram peak on the first high, forming a bearish divergence.
- Price confirmation: A bearish candlestick pattern (such as a shooting star or engulfing bar) appears at the new high, and volume is lighter than on the prior high.
- Outcome: The stock reverses and gives back a significant portion of the prior rally. The lesson: divergences are most reliable when price action and volume also show weakness at the same level.
Walkthrough 3: Zero-line confirmation for a swing entry
- Signal sequence: MACD line crosses above the signal line below zero, then both lines cross above zero together. This second event, the zero-line cross, is the entry trigger.
- Price confirmation: The stock breaks above a multi-week consolidation range on above-average volume.
- Outcome: A sustained move follows because the zero-line cross confirmed that the short-term EMA has genuinely overtaken the long-term EMA, not just temporarily spiked above it.
Practical lessons checklist for reviewing your own charts:
- Do: Check where the crossover happens relative to the zero line before acting.
- Do: Look at histogram bar size and direction for two to three bars before the crossover.
- Do: Confirm with price structure (support, resistance, trendline).
- Don’t: Act on a crossover that happens in the middle of a sideways range.
- Don’t: Ignore divergences at key price levels just because the trend looks strong.
- Don’t: Enter on the first histogram bar that shrinks; wait for a second bar to confirm deceleration.
How to monitor MACD live using Handy Markets alerts
Watching charts all day is neither practical nor necessary when you have a well-configured alert system. Here is how to set up MACD-style monitoring through Handy Markets.
Step-by-step alert setup:
- Go to Handy Markets price alerts and create a free account or log in.
- Search for the stock or asset you want to monitor and open its alert page.
- Set a price-level alert at the price that corresponds to where a MACD crossover would likely occur, based on your current chart reading. For example, if a stock is approaching a support level where a bullish crossover has historically fired, set an alert at that price.
- Choose your notification channel: Telegram and email work well for most traders; webhook integrations suit those who want alerts piped into a custom dashboard.
- Repeat for each stock on your watchlist, grouping them by setup type (crossover candidates, divergence candidates, zero-line candidates).
Useful alert rules to configure:
- Crossover alert: Trigger when price reaches the level where the MACD line and signal line are converging on your chart.
- Zero-line cross alert: Set a price alert at the level where the 12-period EMA would cross the 26-period EMA, based on current EMA values.
- Histogram threshold alert: Alert when price moves to a level where the histogram has historically reversed direction.
Handy Markets also supports real-time data monitoring across stocks, ETFs, indices, and tokenized assets in one dashboard, which makes it straightforward to keep a MACD watchlist without switching between multiple platforms.
Pro Tip: Organize your watchlist into two tiers: “active setups” (stocks where a MACD signal is imminent based on your chart review) and “monitoring” (stocks in a trend but not yet near a signal). Review the active tier daily and the monitoring tier weekly. This cuts screen time significantly without missing setups.
Handy Markets provides market data and price alerts, not trade execution. Think of it as your signal radar: it tells you when to look, and your broker handles the rest.
What actually works with MACD: an editorial perspective
The most common mistake traders make with MACD is treating it as a standalone system. It was never designed to be one. Gerald Appel developed it in the late 1970s as a way to measure momentum shifts within a trend, not to generate buy and sell signals in isolation. When you use it that way, the results tend to disappoint.
The heuristics that hold up in practice are simpler than most guides suggest. Prefer zero-line filters over raw crossovers: a crossover above zero in an uptrending stock is a genuinely different signal from a crossover below zero in a downtrending one. Use the histogram as your early-warning system, not the crossover itself. When histogram bars start shrinking, that is the moment to sharpen your attention, not after the lines have already crossed.
Range-bound markets are where MACD loses most of its value. If a stock has been trading in a tight range for several weeks, the MACD line will cross the signal line repeatedly with no directional follow-through. The fix is not a better MACD setting; it is a trend filter. An ADX reading below 20 is a reliable signal to step back and wait for a clearer environment.
Position sizing matters more than signal precision. A trader who risks 0.5% of capital per trade and is right 50% of the time will outperform one who risks 5% per trade and is right 60% of the time, given normal loss streaks. MACD gives you a framework for timing; discipline and position sizing determine whether that framework produces consistent results over time.
The traders who get the most out of MACD are not the ones who find the perfect settings. They are the ones who apply consistent rules, confirm signals with at least one additional factor, and avoid trading the indicator in conditions where it historically underperforms. That combination, consistency plus context, is what separates a useful tool from a frustrating one.
Handy Markets: real-time data and alerts for MACD traders
Tracking MACD signals manually across a watchlist of stocks is time-consuming. Handy Markets gives you a faster path: real-time price data across stocks, ETFs, indices, and tokenized assets in one place, with price alerts you can configure in minutes and receive via Telegram, Discord, Slack, SMS, Webhook, or Email.
For traders using MACD, the workflow is direct. Set price-level alerts at the points where your chart analysis suggests a crossover or zero-line event is approaching. When the alert fires, you check the chart, confirm the signal, and decide. No constant screen-watching required.
Set up your first price alert for free and see how quickly you can build a MACD-ready watchlist across multiple asset classes.
Sources
The sources below were used to build this guide and are worth bookmarking for deeper study.
- What Is MACD? - Investopedia
- What Is MACD? - Moving Average Convergence/Divergence - Fidelity
- Moving Average Convergence Divergence (MACD) - Interactive Brokers
- MACD Indicator: The Momentum Tool That Spots Trend | TradeAlgo
This article is general information, not a substitute for advice from a qualified financial advisor. Consult a qualified financial professional about your own circumstances before acting on anything here.