TL;DR:
- Most investors recognize their portfolio’s gains or losses but often ignore why they occurred or how risk impacted the results. Implementing proper tracking methods, including all return components and regular reconciliation, provides clarity that improves decision-making and contextualizes performance. Accurate, consistent monitoring using the right tools and metrics reveals true strategy effectiveness and guides better investment choices over time.
Most investors know their portfolio went up or down. Far fewer know why, by how much relative to risk, or whether their returns reflect skill or just a rising tide. This portfolio performance tracking guide exists to close that gap. We see it constantly: investors confuse raw price gains with actual returns, overlook dividends and fees, and make rebalancing decisions on incomplete data. The result is a distorted picture that leads to overconfidence in good markets and unnecessary panic in bad ones. With the right tracking method and a consistent process, you gain clarity that genuinely improves your decisions.
Table of Contents
- Key Takeaways
- Your portfolio performance tracking guide starts here
- How to calculate portfolio returns step by step
- Common pitfalls in performance tracking
- Reading your results and making better decisions
- My perspective on what actually moves the needle
- Stay ahead with Handy’s real-time market monitoring
- FAQ
Key Takeaways
| Point | Details |
|---|---|
| Choose the right return method | Use TWR to evaluate strategy performance and MWR to understand your personal experience with cash flows. |
| Include all return components | Dividends, fees, splits, and currency effects must be factored in or your returns will be systematically wrong. |
| Reconcile with custodian data | Cross-check your tracking records against official statements regularly to catch errors before they compound. |
| Interpret results in context | A return number without a risk measure or benchmark comparison tells only half the story. |
| Automate where possible | Real-time monitoring tools reduce manual errors and let you focus on analysis rather than data entry. |
Your portfolio performance tracking guide starts here
Before you calculate a single return, you need to gather the right raw material. Skipping this step is exactly why so many DIY investors end up with numbers that don’t match reality. Think of this phase as building the foundation. A shaky foundation means every calculation built on top of it is unreliable.
Here is the data you need to collect before tracking anything:
- Transaction history: Every buy, sell, deposit, and withdrawal with exact dates and amounts
- Dividend and income records: Cash dividends, reinvested dividends (DRIPs), and interest payments
- Fee and cost data: Brokerage commissions, management fees, custody fees, and tax costs
- Corporate actions: Stock splits, spin-offs, mergers, and rights issues that change share counts or prices
- Historical price data: Closing prices for each holding on each date you intend to evaluate
- Currency information: If you hold foreign assets, exchange rates on transaction and valuation dates
Once you have this data assembled, you need a home for it. Your options fall into three main categories.
| Tool Type | Best For | Key Limitation |
|---|---|---|
| Spreadsheet (Excel, Google Sheets) | Full control, custom formulas | Manual entry, error-prone at scale |
| Dedicated portfolio software | Automated imports, accuracy | Learning curve, possible subscription cost |
| Brokerage platform reports | Quick checks, statement reconciliation | Often excludes fees, outside holdings |
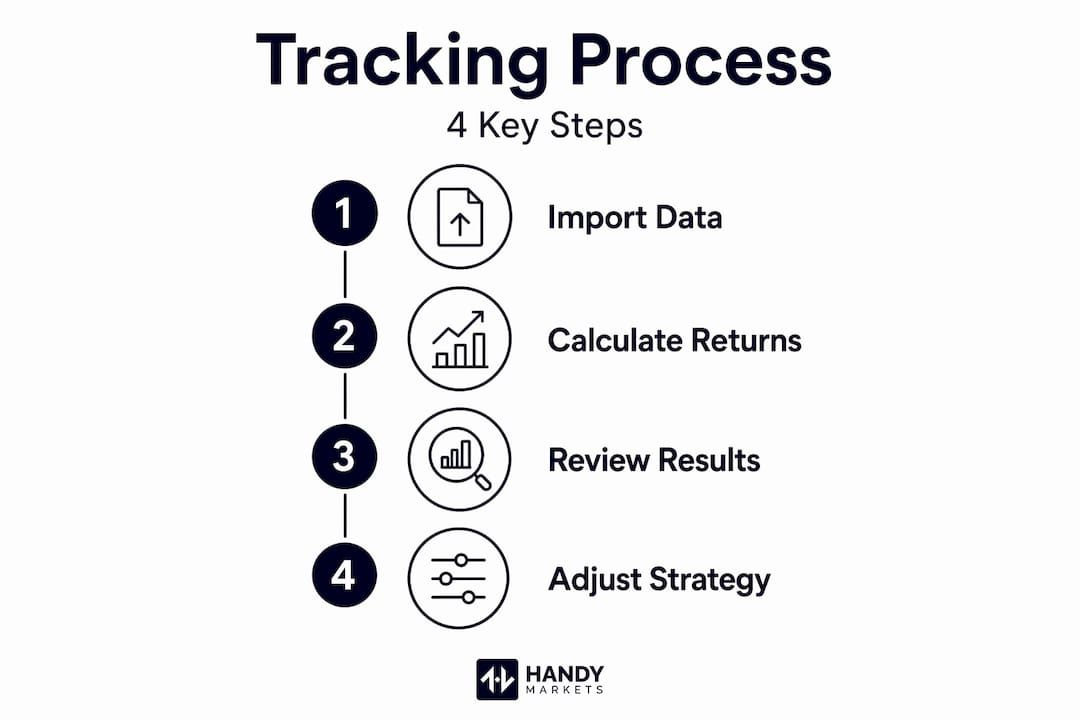
Viewing performance as a process from data import through to reporting, rather than a one-off calculation, is what separates investors who track accurately from those who don’t.
Pro Tip: Set up a single master spreadsheet or software account from day one. Recreating historical data retroactively is time-consuming and introduces gaps. The best time to start is now, even if you only have partial records.
How to calculate portfolio returns step by step
With your data ready, you can build a tracking system that actually reflects what happened in your portfolio. The biggest conceptual fork in the road is choosing between two return methods, and using the wrong method leads to conclusions that can genuinely mislead you.
Here is how to approach the full calculation process:
- Log portfolio value at regular intervals. Record the total portfolio value at the start and end of each period. Monthly snapshots work well for most individual investors.
- Calculate Time-Weighted Return (TWR). TWR breaks your total investment period into sub-periods separated by each cash flow event. It calculates the return for each sub-period independently and then links them together. This method neutralizes the effect of deposits and withdrawals, so it tells you how the strategy performed regardless of when you added money. If you want to compare your results against a benchmark or a fund manager, TWR is the correct lens.
- Calculate Money-Weighted Return (MWR) or IRR. MWR weights returns by the size and timing of your actual cash flows. It tells you how you personally did as an investor, accounting for the fact that you may have deposited a large sum right before a downturn or withdrawn at the wrong time. For evaluating your own wealth accumulation experience, MWR is more relevant.
- Incorporate dividends and income. Total return calculations must include reinvested dividends and income, not just price appreciation. For growth stocks this may be minor. For income-focused portfolios, ignoring dividends can understate returns by several percentage points annually.
- Adjust for fees. Calculate returns on a net-of-fees basis. A gross return of 9% with 1.5% in annual fees is a 7.5% net return. Over a decade, that difference compounds into a significant gap in actual wealth.
- Account for splits and corporate actions. A stock that appeared to drop 50% may have simply undergone a 2-for-1 split. Without adjusting for corporate actions, your return history will show phantom losses and gains.
- Build a time-series chart. Tracking portfolio value over time with a simple growth chart reveals patterns that raw numbers hide: drawdown depth, recovery speed, and the consistency of growth through different market conditions.
The TWR versus MWR distinction is worth dwelling on. Imagine you invested $10,000 in January, added $50,000 in November right before a market correction, and ended the year down 5% on the combined balance. Your TWR might show a positive 4% for the underlying strategy for most of the year. Your MWR would show a negative return because you invested the bulk of your capital at the worst moment. Separating these two metrics tells the complete story: the strategy was fine, but your timing cost you.
Pro Tip: If you use Google Sheets, the built-in XIRR function calculates MWR automatically from a list of cash flows with dates. Pair it with a manually maintained TWR column for a complete picture.

Common pitfalls in performance tracking
Even investors who understand the concepts above make errors in practice. Knowing where the traps are helps you build habits that keep your data clean and your conclusions honest.
- Treating price return as total return. Ignoring dividends, fees, and corporate actions systematically overstates or understates performance. This is one of the most common DIY tracking errors.
- Applying TWR when MWR is what you need, or vice versa. If you ask “did my strategy beat the S&P 500?” use TWR. If you ask “how much wealthier am I because of my investing?” use MWR. Mixing the two produces answers to questions you weren’t asking.
- Skipping custodian reconciliation. Your internal tracking and your brokerage statement should agree. When they don’t, an error exists somewhere. SEC custody rules require professional managers to reconcile with custodian statements at least quarterly, and individual investors benefit from the same discipline.
- Over-indexing on short-term results. A single quarter tells you almost nothing about investment skill or strategy quality. Tracking matters most when it is consistent over multiple years, not when it is obsessively checked over days.
- Failing to capture all accounts. If you hold assets across a brokerage account, a 401(k), and a crypto wallet but only track the brokerage account, you are analyzing a fragment of your actual financial picture.
Reconciliation discipline with custodian statements is not just a compliance formality. Periodic alignment prevents phantom discrepancies caused by missing transactions, foreign exchange mismatches, and unrecorded fees from silently distorting your entire return history.
The antidote to most of these errors is a monthly review ritual. Set aside 30 minutes at the end of each month to update your records, reconcile against your statements, and log the closing portfolio value. Small errors caught early are trivial to fix. Errors allowed to accumulate over a year become genuinely painful to untangle.
Reading your results and making better decisions
Tracking returns is only useful if you interpret them correctly. A 12% annual return sounds excellent until you learn it came with twice the volatility of the benchmark and a 35% drawdown along the way. Professional portfolio monitoring evaluates three dimensions together: raw returns, risk, and risk-adjusted performance.
Here is what to examine once your tracking data is clean:
- Benchmark comparison. Compare your portfolio’s TWR against a relevant index, such as the S&P 500 for a U.S. equity portfolio or a blended benchmark for a mixed allocation. This separates market-driven gains from genuine value added. You can explore how to compare across markets to build a meaningful comparison framework.
- Volatility and standard deviation. How much did your portfolio swing to produce those returns? Higher volatility means more emotional strain and higher risk of making poor decisions during drawdowns. Measure it; don’t just feel it.
- Maximum drawdown. The largest peak-to-trough decline in your portfolio value over a period. A portfolio that dropped 40% at some point during the year but finished up 15% tells a very different story than one that gained a steady 15% with minimal drawdown.
- Sharpe ratio. This divides your excess return (return above the risk-free rate) by your portfolio’s standard deviation. A Sharpe ratio above 1.0 is generally considered good. Below 0.5 suggests you are taking more risk than you are being compensated for.
- Goal alignment. Are you on track for your target date and target amount? Connect your tracking numbers to your actual objectives. An investor targeting retirement in 10 years with a 7% annualized return goal needs different analysis than a trader targeting monthly outperformance.
Consistent performance monitoring connects directly to your investment horizon and understanding of risk versus return. The investors who use their tracking data to rebalance systematically and adjust allocations with evidence tend to build more wealth over time than those who react to headlines.
My perspective on what actually moves the needle
I’ve spent years watching investors spend enormous energy on which stocks to pick while barely glancing at their tracking methodology. And I’ve seen the consequences. Someone calculates a 22% annual return, feels confident, and doubles down on a strategy. Then they discover they forgot to account for the large deposit they made in March. The real return was 11%. That’s not a rounding error. That’s a completely different investment reality.
What I’ve learned is that the TWR versus MWR distinction is genuinely clarifying the first time you apply it. Before I started separating the two, I had no clean way to answer the question: “Is my strategy working, or did I just get lucky with timing?” Once you compute both, the answer becomes visible.
I’ve also found that visual tracking, meaning a simple chart of total portfolio value over time, does something that numbers alone don’t. It shows you the shape of your investing experience. Seeing a drawdown plotted as a curve rather than a number makes it feel real but also finite. It helped me personally stay the course during volatile stretches rather than making reactive trades I would have regretted.
My honest advice: accept that tracking will never be perfectly precise. Currency rounding, fractional shares, and fee accruals will always introduce small discrepancies. The goal is consistent, close-enough accuracy, not obsessive perfection. A tracking system you actually maintain beats a perfect system you abandon after two months.
Stay ahead with Handy.Markets real-time market monitoring
Managing a portfolio means staying informed across asset classes, and that requires more than a monthly spreadsheet review. Handy makes it straightforward to monitor live prices across stocks, crypto, commodities, forex, and indices all from one place, so you never lose sight of what’s moving your portfolio value in real time.
With Handy.Markets price alert system, you can set instant notifications through Telegram, Discord, Slack, SMS, email, or Webhook the moment an asset hits a price threshold you care about. That means you spend less time watching screens and more time analyzing. If you want a single hub for tracking all your markets alongside custom alerts, Handy gives you that foundation without complexity. Pair the real-time data with the tracking methods in this guide and you have a complete monitoring setup built for informed decisions, not guesswork. Explore real-time alert strategies to get started.
FAQ
What is the difference between TWR and MWR?
Time-Weighted Return (TWR) measures strategy performance by eliminating the impact of cash flows, making it ideal for comparing against benchmarks. Money-Weighted Return (MWR) reflects your personal return experience, factoring in the size and timing of deposits and withdrawals.
How often should I track my portfolio performance?
Monthly tracking strikes the right balance for most individual investors. Record your portfolio value at month-end, reconcile against your brokerage statements, and review quarterly for deeper analysis of returns, risk, and goal progress.
What data do I need to track portfolio performance accurately?
You need complete transaction history, dividend and income records, fee data, corporate action adjustments, historical prices, and currency rates if you hold foreign assets. Missing any of these leads to systematically inaccurate returns.
Why do my portfolio returns differ from my brokerage’s reported returns?
Discrepancies usually stem from different return methodologies, missing fee adjustments, or unaccounted corporate actions. Regular reconciliation with your custodian’s statements helps identify and resolve these differences before they distort your analysis.
What is a good Sharpe ratio for a portfolio?
A Sharpe ratio above 1.0 is generally considered favorable, indicating you are earning adequate return per unit of risk. Below 0.5 suggests the portfolio carries more volatility than the returns justify, which is worth addressing through rebalancing or allocation changes.