TL;DR:
- Interpreting price changes involves distinguishing genuine asset value shifts from sentiment swings or noise. Recognizing types such as trends, reversals, or consolidations is essential, with volume confirming the strength of moves. Combining technical analysis, fundamental insights, and behavioral understanding enables accurate market assessments and better trading decisions.
Interpreting price changes is the process of identifying whether a market move reflects a genuine shift in asset value, a temporary sentiment swing, or random noise. Every trader and investor needs this skill to avoid costly overreactions and to spot real opportunities. Tools like the Consumer Price Index (CPI), 50-day moving averages, and valuation frameworks from Rule 1 Investing all feed into how to interpret price changes with confidence. This guide walks you through the types of price moves, their root causes, the technical signals that confirm them, and the behavioral traps that distort your read on the market.
How to interpret price changes: types and recognition
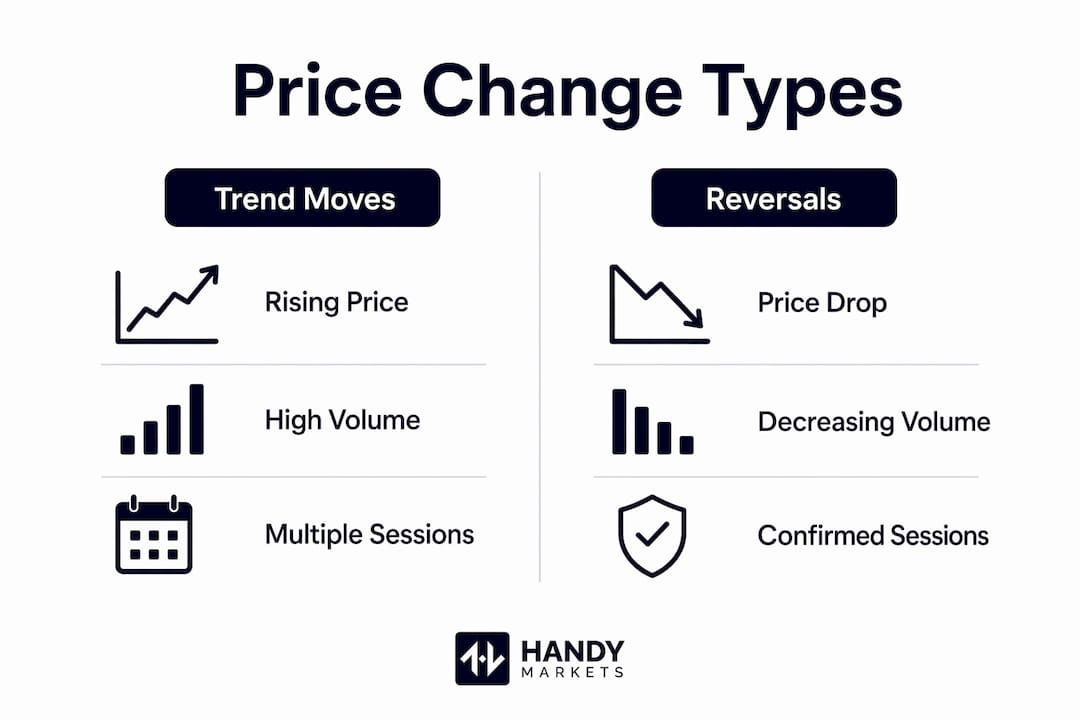
Price changes fall into three fundamental categories: trend moves, reversals, and consolidations. Recognizing which category a move belongs to is the first step in any sound analysis.

A trend move is a sustained directional shift backed by volume and confirmed over multiple sessions. A reversal is a change in direction, often preceded by exhaustion signals like a volume spike on a down day after a prolonged rally. A consolidation is sideways movement where buyers and sellers are in temporary balance, often before a breakout in either direction.
Market microstructure generates pressure signals that shape whether positive or negative momentum continues or fades. This means the mechanics of how orders flow through an exchange actually influence the next price move, not just the news. Volume is the clearest confirmation tool. A price move on thin volume is suspect; the same move on heavy volume carries real weight.
| Price Change Type | Typical Signal | Trader Interpretation |
|---|---|---|
| Trend continuation | Rising price + rising volume | Momentum is intact; hold or add |
| Reversal | Volume spike against trend direction | Trend exhaustion; consider exit or hedge |
| Consolidation | Narrow range, declining volume | Wait for breakout confirmation before acting |
| Gap up/down | Price jumps at open | News-driven; verify with volume before trading |
Pro Tip: Never act on a single candlestick. Confirm any reversal signal with at least two consecutive sessions moving in the new direction before changing your position.
What actually drives price changes in financial markets?
Price changes are not random. Two forces dominate: changes in expected cash flows and changes in expected returns. Research from the National Bureau of Economic Research confirms that cash flow fluctuations are the primary driver of US corporate valuation volatility, while expected return changes play a relatively minor role. That finding matters because it tells you to focus your analysis on earnings revisions and revenue guidance, not just interest rate speculation.
Supply and demand forces amplify these fundamentals. When institutional investors rotate out of a sector, prices fall even if underlying business performance is unchanged. That is sentiment at work, not valuation. The two forces often move in opposite directions, which is exactly why prices can seem irrational in the short term.
Inflation data adds another layer. Key drivers of price fluctuations include:
- CPI month-over-month data: The monthly CPI rise of 0.3% in February 2026 annualizes to 3.7%, well above the headline 2.4% year-over-year rate. Month-over-month figures strip out base effects and give you a cleaner read on current inflation momentum.
- Supply shocks: Commodity disruptions, supply chain bottlenecks, and geopolitical events create sudden price spikes that are often temporary.
- Earnings surprises: A company reporting earnings 15% above consensus will see its stock reprice immediately, reflecting updated cash flow expectations.
- Sentiment shifts: Fear and greed cycles push prices away from fair value, sometimes for weeks or months at a time.
One more important constraint: the Efficient Market Hypothesis accounts for roughly 20% of daily stock return variance. That means price-driven factors and sentiment dominate the other 80% of daily moves. News alone does not explain most of what you see on a price chart each day.
How to analyze price changes using technical indicators
Technical analysis gives you a structured way to read price charts and confirm what the fundamentals suggest. Here is a practical step-by-step process for analyzing market price trends using the most reliable indicators.
- Check the 50-day moving average. The 50-day moving average is a critical trend benchmark. When price breaks below it on high volume, that signals a bearish medium-term trend that can persist for weeks. When price holds above it during a pullback, the uptrend remains intact.
- Measure volume on every significant move. Volume is the market’s vote of confidence. A breakout above resistance on three times average daily volume is far more credible than the same breakout on below-average volume.
- Identify support and resistance levels. Support is a price zone where buyers have historically stepped in. Resistance is where sellers have dominated. A clean break through resistance, confirmed by volume, signals a new price range is being established.
- Look for momentum divergence. When price makes a new high but an indicator like the Relative Strength Index (RSI) makes a lower high, that divergence warns that buying pressure is fading. It does not guarantee a reversal, but it raises the alert level.
- Confirm with multiple timeframes. A bullish signal on a daily chart carries more weight when the weekly chart also shows an uptrend. Conflicting signals across timeframes are a reason to wait, not act.
Pro Tip: Fake breakouts are common near round-number price levels. Before entering on a breakout, wait for the price to close above the level for a full session, not just trade through it intraday.
Stagnating or sideways markets present their own challenge. When experts disagree on direction, technical levels become even more important because they define the boundaries of the range you are trading within.
Combining fundamental and behavioral insights
The most reliable interpretation of any price move combines what the numbers say with what investor psychology is doing. Short-term prices are driven by sentiment; long-term prices are anchored to business fundamentals. Knowing which force is in control at any given moment is the real skill.
Understanding market fluctuations requires separating volatility from risk. Volatility is price movement. Risk is the permanent loss of capital. These are not the same thing, and treating them as identical is one of the most expensive mistakes a trader can make.
Here is how to apply a combined approach in practice:
- Use a margin of safety. If a stock’s intrinsic value is $100 and it trades at $70 after a market selloff, that gap is your margin of safety. The price drop may reflect fear, not a change in the business. Viewing price drops as discounts on quality assets is a core principle of value investing.
- Watch for sentiment extremes. When the VIX spikes above 30, fear is dominating. That environment often creates mispricings that fundamental buyers can exploit.
- Track earnings revisions. If analysts are cutting earnings estimates while the stock price holds steady, the market is ignoring a real fundamental deterioration. That is a warning sign, not an opportunity.
- Separate noise from signal. A 2% daily move in a high-beta stock is normal volatility. The same move in a low-volatility utility stock deserves attention. Context determines whether a price change is meaningful.
When a sharp decline hits financial markets, the behavioral response is often to sell first and ask questions later. That reaction is exactly when a disciplined framework separates profitable traders from reactive ones.
Common mistakes when evaluating price dynamics
Even experienced traders fall into predictable traps when evaluating price dynamics. Recognizing these errors in advance protects your capital and your decision-making process.
- Overreacting to short-term volatility. A single bad session does not break a trend. Checking your volatility framework before acting on a one-day move prevents impulsive exits.
- Misreading inflation data. Month-over-month CPI is more reliable for trend identification than year-over-year figures, which are distorted by base effects. Traders who only track headline year-over-year numbers miss the current inflation momentum.
- Ignoring volume confirmation. Price without volume is an opinion. Volume is the evidence. Never treat a price signal as confirmed until volume supports it.
- Confusing momentum with deterioration. A stock falling 20% on no news may be experiencing normal volatility in a sector rotation. A stock falling 20% on an earnings miss and guidance cut is experiencing real business deterioration. The price move looks identical; the cause is completely different.
- Anchoring to a prior price. Traders often hold losing positions because they are anchored to the price they paid. The market does not know or care what you paid. Evaluate every position on current fundamentals, not purchase price.
Pro Tip: Before acting on any price signal, run a three-point check: confirm the move with volume, verify it against the 50-day moving average, and check whether any fundamental news explains it. All three should align before you trade.
Key takeaways
Interpreting price changes accurately requires combining technical signals, fundamental drivers, and behavioral awareness to separate meaningful moves from market noise.
| Point | Details |
|---|---|
| Types of price moves | Classify moves as trend, reversal, or consolidation before acting on them. |
| Cash flows drive valuation | Focus earnings revisions and revenue guidance as primary price drivers. |
| 50-day MA is your anchor | A break below the 50-day moving average on high volume signals a medium-term bearish shift. |
| Volatility is not risk | Price drops on quality assets can be buying opportunities, not permanent losses. |
| Use month-over-month CPI | Monthly inflation data gives a cleaner, more current read than headline year-over-year figures. |
What we have learned from watching markets move
At Handy, we have watched traders make the same costly mistake repeatedly: they treat every price move as equally meaningful. A 3% drop in a tech stock during a broad market selloff is not the same as a 3% drop triggered by an accounting restatement. The numbers look identical on a chart. The implications could not be more different.
The traders who consistently outperform are not the ones with the fastest data feeds. They are the ones who have built a repeatable process for asking the right questions before they act. Is this move confirmed by volume? Does it align with the trend on the weekly chart? Is there a fundamental explanation, or is this pure sentiment? Those three questions, asked every single time, filter out most of the noise.
We also believe that preparation beats reaction every time. Knowing your entry and exit criteria before a price move happens means you are executing a plan, not responding to fear. The market will always move faster than your emotions can process. Your framework should not.
Track every price move with Handy.Markets
Real-time data is the foundation of sound price interpretation. Handy gives you live prices, percentage changes, and alerts across stocks, ETFs, crypto, forex, commodities, and indices, all in one place.
Setting up a price alert takes under a minute, and you can receive notifications through Telegram, Discord, Slack, SMS, Webhook, or Email. That means you never miss a breakout, a support breach, or a volume spike while you are away from your screen. Explore the full markets dashboard to start tracking the assets that matter to your strategy. When price moves, you will know first.
FAQ
What does it mean to interpret a price change?
Interpreting a price change means determining whether a move reflects a genuine shift in asset value, a sentiment-driven overreaction, or random short-term noise. The goal is to distinguish signals worth acting on from moves worth ignoring.
How does the 50-day moving average help with price analysis?
The 50-day moving average acts as a trend benchmark. A price break below it on high volume signals a bearish medium-term trend, while a price holding above it during a pullback confirms the uptrend remains intact.
Why is month-over-month CPI better than year-over-year for traders?
Month-over-month CPI strips out base effects and gives a cleaner read on current inflation momentum. The February 2026 monthly CPI rise of 0.3% annualizes to 3.7%, far above the 2.4% headline year-over-year figure.
What is the difference between volatility and risk?
Volatility is price movement; risk is the permanent loss of capital. A quality asset dropping 15% in a market selloff is volatile, but it is not necessarily a permanent loss if the underlying business remains sound.
How do i confirm a price signal before trading?
Confirm any price signal by checking volume, verifying the move against the 50-day moving average, and identifying whether a fundamental catalyst explains it. All three factors should align before you commit to a trade.