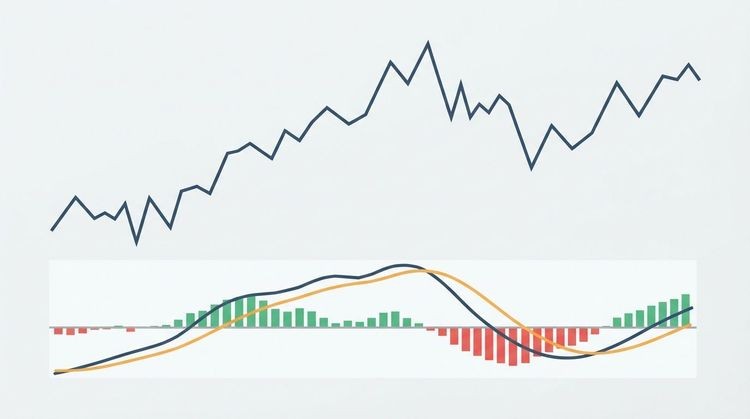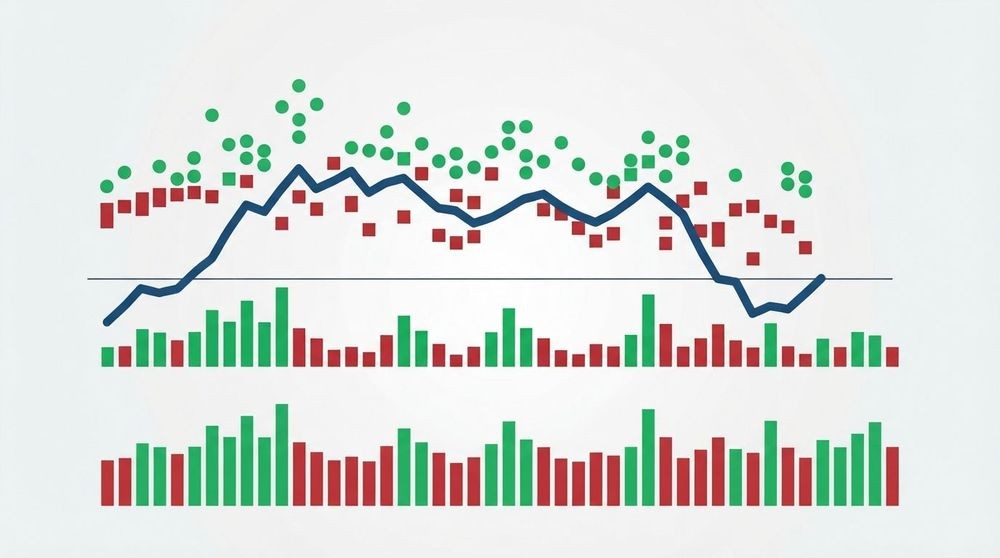
Market breadth measures how many individual stocks are participating in a market move, not just whether the headline index is rising or falling. Think of it as the pulse beneath the price chart: a rally where a large majority of the S&P 500’s members are advancing tells a very different story than one carried by 80 mega-caps while the rest drift sideways. The single most practical takeaway is this — use breadth as a confirmation and diagnostic tool, not as a standalone buy or sell trigger. When breadth and price agree, conviction rises. When they diverge, caution is warranted.
The core breadth indicators you will encounter most often:
- Advance–Decline (A/D) line — cumulative running total of daily advancers minus decliners
- Advance–Decline ratio — advancers divided by decliners on a given day
- % of stocks above their 50-day or 200-day moving average — trend health across the full universe
- New 52-week highs minus new 52-week lows — captures extreme participation conditions
- TRIN (Arms Index) — volume-weighted advance/decline ratio; readings above 1.0 favor sellers
- McClellan Oscillator and Summation Index — smoothed breadth momentum and its cumulative form
- Zweig Breadth Thrust — a rare, high-conviction signal triggered by a rapid surge from oversold to overbought breadth
Key Takeaways
Market breadth is a participation measure, not a price measure — use it to confirm index moves and flag divergences, never as a standalone timing trigger.
| Point | Details |
|---|---|
| Breadth measures participation | Count advancing vs. declining stocks to see whether an index move is broadly supported or narrowly led. |
| Confirmation raises conviction | When the A/D line and the index trend together, trend-following entries carry stronger evidence behind them. |
| Divergence signals caution | Index at new highs while breadth flattens or falls — tighten stops and reduce size rather than adding exposure. |
| Match timeframe to strategy | Intraday traders need real-time data; swing traders work well with end-of-day A/D and % above MA readings. |
| Handy Markets for live monitoring | Real-time dashboard with multi-channel alerts (Telegram, Slack, Email, SMS) keeps breadth-aware traders informed without manual screen-watching. |
Table of Contents
- What market breadth actually measures — and why it matters
- Common breadth indicators and how to calculate them
- How to read breadth signals: confirmations, divergences, and thrusts
- How sector breadth and timeframe choices shape your analysis
- How traders integrate breadth into setups and risk management
- Where to get breadth data: tools and providers compared
- Our perspective on breadth monitoring in live markets
- Real-time breadth monitoring with Handy Markets
- Sources
What market breadth actually measures — and why it matters
A headline index like the S&P 500 is cap-weighted, which means a handful of the largest companies can pull the whole number higher even when most constituents are declining. Market breadth indicators cut through that distortion by counting how many stocks are advancing versus declining, giving you a participation view the index price alone cannot provide.
The clearest way to see this is to plot the NYSE Advance–Decline line directly beneath the S&P 500 price chart. During healthy bull phases, both lines trend upward together. During the late stages of a bull market or a narrowing rally, the index can continue making new highs while the A/D line flattens or rolls over, because fewer and fewer stocks are doing the heavy lifting. That divergence is one of the earliest structural warnings available to traders.
Breadth and concentration are related but distinct concepts. Breadth measures participation distribution — how widely gains or losses are spread across the universe. Concentration measures dependence on a small number of large drivers. Both matter: a market can show moderate breadth while still being dangerously concentrated in a single sector, so reading them together gives a fuller picture than either alone.
Common breadth indicators and how to calculate them
Each breadth measure answers a slightly different question about participation. Here is a catalog with formulas and a worked example.
1. Advance–Decline (A/D) daily value
Formula: A/D = Advancers − Decliners
On a given day, if more NYSE stocks advance than decline, the daily A/D value is positive.
2. Cumulative A/D line
Formula: A/D Line (today) = A/D Line (yesterday) + Today’s A/D value
Starting from an arbitrary base (often 0 or 10,000), you add each day’s A/D value to build a running total. The cumulative A/D line is updated daily by adding the new daily A/D value to the previous total. Plot this under the index price to spot confirmations and divergences visually.
3. Advance–Decline ratio
Formula: A/D Ratio = Advancers ÷ Decliners
Higher advance-decline ratios signal strong participation, values near 1.0 indicate a neutral session, and lower ratios suggest broad selling pressure.
4. Percent of stocks above a moving average
Formula: % Above MA = (Stocks trading above their N-day MA ÷ Total stocks in universe) × 100
Common lookbacks are 20, 50, and 200 days. For the S&P 500, you divide the count of constituents above their 200-day MA by 500 and multiply by 100. Higher percentages of stocks above their moving averages generally reflect a healthy trend; lower percentages often coincide with oversold conditions. Because the S&P 500 constituent list changes over time, using an up-to-date roster is critical for accurate readings.
5. New 52-week highs minus new 52-week lows
Formula: Net New Highs = New 52-week Highs − New 52-week Lows
A persistently positive reading confirms broad participation in an uptrend. When new lows begin to outnumber new highs even as the index holds near its peak, that divergence often precedes a correction.
6. TRIN (Arms Index)
Formula: TRIN = (Advancers ÷ Decliners) ÷ (Advancing Volume ÷ Declining Volume)
TRIN adds a volume dimension to the simple advance/decline count. A reading below 1.0 means more volume is flowing into advancing stocks — bullish. Above 1.0 means declining stocks are absorbing more volume — bearish. Extreme readings (above 2.0 or below 0.5) often mark short-term turning points.
7. McClellan Oscillator and Summation Index
The McClellan Oscillator is the difference between a 19-day exponential moving average (EMA) and a 39-day EMA of the daily A/D values. Positive readings indicate expanding breadth momentum; negative readings indicate contraction. The McClellan Summation Index is simply the running cumulative total of daily Oscillator readings — it moves more slowly and is better suited for identifying intermediate-term trend shifts.
8. Zweig Breadth Thrust
This is a rare signal: the 10-day EMA of advancing stocks as a percentage of total issues (advancers plus decliners) moves from below 40% to above 61.5% within 10 trading days. When it triggers, backtests suggest it has historically preceded strong forward returns, though it fires infrequently and should be treated as one data point in a broader analysis, not a guaranteed entry signal.
Worked example — updating the A/D line:
The line rises on net positive days and falls on net negative ones. A sustained upward slope confirms broad participation; a flat or declining line during an index rally is the divergence signal worth watching.
How to read breadth signals: confirmations, divergences, and thrusts
Breadth provides a look under the surface of an index that price alone cannot offer. The three core interpretive frameworks are confirmation, divergence, and thrust.

Confirmation occurs when the index and breadth move in the same direction. The S&P 500 makes a new high and the A/D line also makes a new high — that is a healthy, broadly supported rally. Confirmation raises conviction for trend-following positions.
Divergence is the more actionable signal. When the index climbs to a new high but the A/D line fails to follow, fewer stocks are participating in the move. That narrow leadership often precedes a pullback or a more significant reversal. The inverse also applies: if the index makes a lower low but the A/D line holds above its prior low, selling pressure may be concentrated in a few large names rather than the broader market, which can signal a potential recovery.
Two historical patterns illustrate this well. In the months leading into the 2000 technology peak, the NYSE A/D line had already been declining for nearly two years while the Nasdaq continued to make new highs — a textbook negative divergence. Conversely, in late 2022 and into 2023, the A/D line began recovering before the major indices confirmed their lows, offering an early signal that selling was losing breadth.
Breadth thrusts are rapid expansions from deeply oversold to overbought readings. The Zweig Breadth Thrust described above is the most cited example. These events are rare, but when they occur they tend to mark the beginning of a new intermediate-to-long-term uptrend rather than a short-term bounce.
Pro Tip: Never rely on a single breadth measure. Require agreement across at least two breadth families — for example, the A/D line plus the percent above the 200-day MA plus net new highs — before treating a divergence as a high-conviction signal. A single indicator can produce false readings during low-volume holiday sessions or when index constituents are being rebalanced.
False signals are most common during low-volume periods, sector rotations, and index rebalancing events. Pairing breadth with price trend (is the index above or below its 200-day MA?) and volume (is volume expanding or contracting on up days?) reduces the noise considerably. For a broader view of how breadth fits into a complete indicator stack, combining it with momentum and volume measures tends to produce more reliable signals than breadth alone.
How sector breadth and timeframe choices shape your analysis
Tracking breadth at the sector level adds a layer of precision that index-wide measures miss. The Global Industry Classification Standard (GICS) provides the taxonomy most traders use to group stocks into 11 sectors, making it straightforward to compute advance/decline ratios, percent-above-MA readings, and new-highs/lows counts within each sector independently.
Why does sector breadth matter? An index-wide reading might look healthy while one or two sectors are quietly deteriorating. Tracking which sectors are leading and which are lagging helps you position within the trend rather than just with it.
Key considerations for sector and timeframe analysis:
- Equal-weight vs. cap-weight: A cap-weighted index can rise on the strength of five or six mega-cap names. An equal-weight version of the same index, or a simple advance/decline count, will reveal whether smaller constituents are participating. When the equal-weight index lags the cap-weight version significantly, breadth is narrowing even if the headline number looks fine.
- Intraday breadth (real-time): Useful for day traders and scalpers. Watch the NYSE TICK (net upticks vs. downticks across all NYSE stocks) and intraday A/D ratios to gauge short-term buying or selling pressure. Real-time data is required for this timeframe.
- Daily breadth (end-of-day): The standard for swing traders. Daily A/D line updates, percent above 50-day MA, and net new highs/lows are the most commonly used measures. End-of-day data is sufficient and widely available at no cost.
- Multi-week breadth (20/50/200-day periods): Best suited for position traders and strategic analysts. The percent of stocks above their 200-day MA is the most stable measure at this horizon and filters out short-term noise effectively.
- Sector rotation signals: When technology breadth deteriorates while energy breadth improves, that rotation is visible in sector-level A/D lines before it shows up clearly in the cap-weighted index.
How traders integrate breadth into setups and risk management
Breadth indicators are most useful as context-setters, not as precise entry and exit triggers. Here is how experienced traders typically build them into a trading plan.
That confirmation raises the probability that the trend has broad support rather than being carried by a handful of names.
Trimming exposure on divergence: When the index makes a new high but breadth fails to confirm, consider reducing position size rather than adding to existing longs. This is not a sell signal — it is a risk-management cue to tighten stops or take partial profits.
Breadth thrusts as regime-change evidence: A Zweig Breadth Thrust or a sharp expansion in the percent of stocks above their 200-day MA from below 20% to above 60% in a short window suggests a potential regime shift from bear to bull. Traders use this as evidence to increase exposure, not as a guarantee of gains.
Position sizing and stops: When breadth is broadly supportive, wider stops and larger position sizes are more defensible. When breadth is diverging or deteriorating, tighter stops and smaller sizes reduce the cost of being wrong.
Common pitfalls to avoid:
- Single-measure dependence: Relying on the A/D line alone misses volume context (TRIN) and trend health (% above MA). Use at least two measures from different breadth families.
- Universe mismatch: Applying NYSE breadth rules to a small-cap or sector-specific portfolio can mislead. Match the breadth universe to the portfolio universe — Russell 2000 breadth for small-cap exposure, S&P 500 breadth for large-cap.
- Stale data for intraday decisions: Using end-of-day breadth data to make intraday decisions introduces a lag that can cost you. Real-time data is necessary for any decision made during the trading session.
- Ignoring constituent changes: Breadth readings can shift when index membership changes. An index rebalancing that adds or removes dozens of stocks will affect the A/D count even if underlying market conditions have not changed.
Breadth works best as a market signal that modifies your conviction level — raising it when breadth confirms, lowering it when breadth diverges. It is not a mechanical system on its own.
Where to get breadth data: tools and providers compared
Choosing the right breadth data source depends on your time horizon, the indicators you need, and your budget. Here is a practical checklist before committing to any provider:
- Does it update in real time (intraday) or end-of-day?
- Which indicators does it cover (A/D line, % above MA, new highs/lows, McClellan, TRIN)?
- How deep is the historical data, and can you backtest strategies against it?
- What visualizations are available (A/D line chart, heatmaps, sector breakdowns)?
- Does it offer alerts via email, Slack, Telegram, or webhook?
- Are the formulas and constituent lists published transparently?
Real-time vs. end-of-day: Intraday traders need live data feeds, which typically come at a higher cost. Swing traders and position traders can work effectively with end-of-day data, which is often available free or at low cost from brokers and financial sites. The latency difference matters enormously for a scalper and almost not at all for a weekly-timeframe analyst.
Data transparency is an underrated criterion. A provider that publishes its constituent list and formula methodology lets you validate readings and catch errors. One that treats its calculations as a black box makes it impossible to diagnose unusual readings.
For validating a provider’s credentials and service reliability, resources like FINRA BrokerCheck can help confirm the professional standing of firms offering data services alongside brokerage functions.
Here is a summary of the main provider categories and the named platforms relevant to breadth monitoring:
| Provider | Update frequency | Key indicators | Historical depth | Visualizations | Alerts | Cost model |
|---|---|---|---|---|---|---|
| breadth.app | End-of-day | A/D line, % above MA, new highs/lows, McClellan | Multi-year | A/D line charts, sector heatmaps | Free tier; paid for full access | |
| StreetStats | End-of-day | A/D, McClellan Oscillator, Summation, TRIN | Multi-year | Breadth charts, historical overlays | Subscription | |
| Charles Schwab (schwab.com) | Real-time (during market hours) | A/D ratio, new highs/lows, % above MA | Limited historical | Basic breadth charts within platform | Email, platform alerts | Free for account holders |
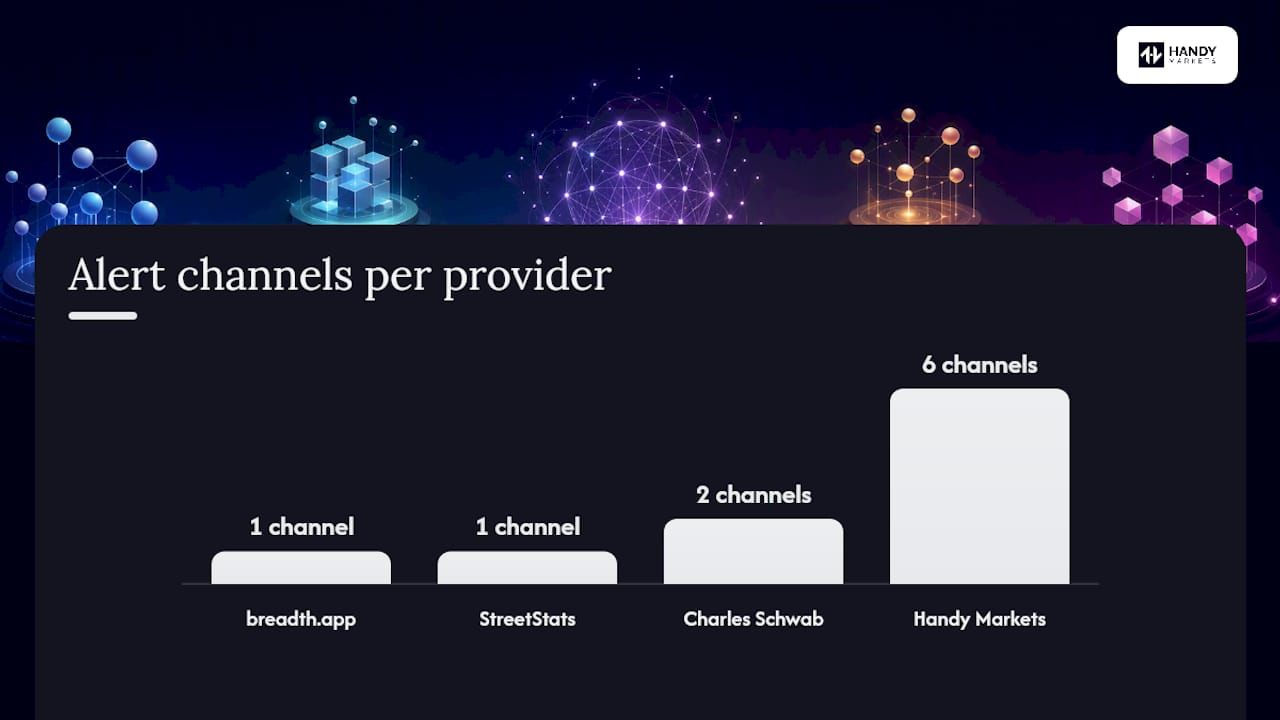
| Handy Markets | Real-time and end-of-day | Price-level alerts across equities, ETFs, indices, and crypto; customizable dashboard | Available | Heatmaps, multi-asset dashboard | Telegram, Discord, Slack, SMS, Webhook, Email | Free tier; subscription for real-time and advanced alerts |
breadth.app is purpose-built for breadth analysis, with a clean interface focused entirely on participation metrics. It suits traders who want a dedicated breadth dashboard without paying for a full data terminal.
StreetStats goes deeper on the McClellan family of indicators and is a strong choice for analysts who rely on the Summation Index for intermediate-term trend assessment.
Charles Schwab offers breadth data as part of its brokerage platform, making it convenient for existing clients who need basic advance/decline and new-highs/lows data without a separate subscription.
Handy Markets takes a different approach: rather than a breadth-only tool, it provides a multi-asset monitoring dashboard with real-time price data across equities, ETFs, indices, commodities, and cryptocurrencies, paired with one of the most flexible alert systems available. Alerts fire through Telegram, Discord, Slack, SMS, Webhook, and Email, which means you can route breadth-related price signals to whatever workflow you already use. For traders who want breadth context alongside live price monitoring across multiple asset classes in one place, that integration is genuinely useful. You can also complement breadth signals with fundamental context by using a tool like Filingsiq to scan SEC filings for the stocks driving your breadth readings.
For a deeper look at how these measures fit into a practical trading guide, the Handy Markets blog covers calculation methods and setup examples in detail.
Our perspective on breadth monitoring in live markets
Breadth analysis is one of those disciplines where the gap between knowing the formula and actually using it well is surprisingly wide. We have seen traders calculate the A/D line correctly, spot a divergence, and then either ignore it because the index kept rising or act on it too early because they treated the divergence as a timing trigger rather than a warning flag.
The honest truth is that breadth tells you about the quality of a move, not its duration. A narrow rally can persist for months — the late stages of the 2017 and 2021 bull markets both showed deteriorating breadth well before the eventual corrections. What breadth gives you is a reason to manage risk more carefully, not a reason to exit immediately.
We also think the alerting infrastructure around breadth monitoring is underappreciated. Most traders check breadth manually at the end of the day, which means they miss intraday deterioration that could inform position sizing before the close. Setting up automated alerts — even simple ones tied to key price levels in breadth-sensitive ETFs or index instruments — keeps you informed without requiring you to watch a screen all day. That is exactly the kind of workflow Handy Markets is built to support.
Real-time breadth monitoring with Handy Markets
Breadth analysis is only as good as the data feeding it, and delayed or fragmented data creates blind spots at exactly the wrong moment. Handy Markets gives traders and analysts a real-time, multi-asset monitoring dashboard where you can track price movements across equities, ETFs, indices, and other asset classes simultaneously, with price alerts that fire the moment a threshold is crossed.
What makes Handy Markets particularly useful for breadth-aware traders:
- Real-time and end-of-day data across equities, ETFs, indices, commodities, and cryptocurrencies in one dashboard
- Customizable alerts delivered via Telegram, Discord, Slack, SMS, Webhook, and Email — route signals to your existing workflow
- Multi-asset heatmaps and sector breakdowns for a visual participation overview at a glance
- Free tier available, with a subscription for real-time data and advanced alert features
- Easy setup — personalize your monitoring dashboard and configure alerts in minutes, no technical background required
Set up your first price alert on Handy Markets today and start monitoring the market moves that matter most to your strategy.
Sources
Wikipedia — Breadth of Market offers a concise, formula-level reference for the core advance/decline concept and is a reliable starting point for verifying definitions before applying them to live data.
Corporate Finance Institute — Market Breadth covers the full indicator catalog (A/D, % above MA, new highs/lows, McClellan, TRIN) with clear explanations of how each is constructed and what it measures. It is particularly useful for analysts who want a single reference that covers multiple indicators without requiring a paid subscription.
IG — What Is Market Breadth and How Can Investors Use It? focuses on practical interpretation: how to read confirmations and divergences, and why pairing breadth with price and volume produces more reliable signals than breadth alone.
QuantifiedStrategies.com — Market Breadth Trading Strategies goes further than most free resources by presenting actual backtested strategy examples, including Zweig Breadth Thrust tests. Useful for traders who want to see how breadth-based rules have performed historically before committing to a setup.
GlobalMarketStructure.com — Market Breadth: Participation and Index Strength is the most rigorous of the freely available resources on the distinction between breadth and concentration. If you are analyzing cap-weighted index behavior and want to understand why a high-breadth reading can coexist with dangerous concentration, this is the source to read.
NAAIM Exposure Index provides a complementary macro lens: it tracks average equity exposure among active investment managers, which can be read alongside breadth to gauge whether professional positioning aligns with or contradicts what participation data is showing. Available at Naaim.
This article is general information, not a substitute for advice from a qualified financial advisor. Consult a qualified financial professional about your own circumstances before acting on anything here.
- Breadth of market
- Market Breadth - Definition, Indicators, Types
- Market Breadth | Participation and Index Strength