TL;DR:
- Stock market breadth measures how many stocks participate in a move, indicating whether a rally is broad or fragile.
- Traders use breadth for confirmation and risk management but not as a sole entry signal, especially during intraday trading.
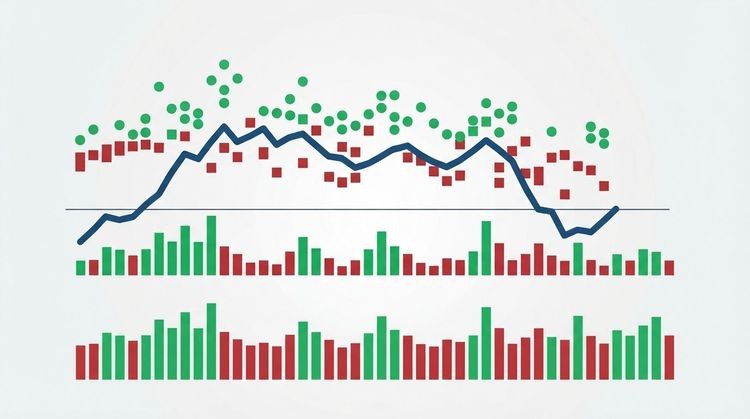
Stock market breadth measures how many individual stocks are participating in a market move — and that single number tells you whether an index rally is broad and healthy or narrow and fragile. When the S&P 500 climbs 1% but only a handful of mega-caps are responsible, breadth is quietly flashing a warning. When hundreds of stocks rise together, the move has real structural support. Active traders use breadth as a confirmation and risk-adjustment tool, not as a standalone entry trigger.
Two things to check right now:
- Advance/Decline line and percent above moving averages — these two measures give you an immediate read on participation at both the short- and long-term level.
- Red flag: If an index prints a new high while the A/D line is falling or fewer stocks are above their 200-day moving average, treat that rally as fragile until breadth confirms.
Table of Contents
- What stock market breadth actually means for your trading
- Common breadth indicators traders rely on
- How traders and analysts use breadth in live decision-making
- How to calculate the main breadth metrics
- Where to get breadth data and what to expect from different sources
- Common limitations and mistakes when using breadth
- A daily breadth checklist for active traders
- Key Takeaways
- Breadth as a risk filter, not a crystal ball
- Real-time breadth monitoring with Handy Markets
- Useful sources and further reading
What stock market breadth actually means for your trading
Breadth, at its core, is a count. It measures how many stocks within a defined universe are advancing versus declining, making new highs versus new lows, or trading above a key moving average. The index price is a weighted average that can be pulled higher by a few large-cap names even as the majority of stocks stagnate or fall. Breadth cuts through that distortion.
The scope of breadth matters. Exchange-level breadth covers every listed stock on the NYSE or NASDAQ, giving the widest possible view of market participation. Index-level breadth narrows the lens to a specific basket, like the S&P 500 or Russell 2000, which is more useful when you trade index-linked products. Sector-level breadth goes one level deeper, showing whether strength inside, say, technology is concentrated in two or three names or spread across dozens.
Here is a concrete example. Suppose the S&P 500 rises 1% on a given day. You check the constituent breadth and find that only 120 of the 500 stocks advanced while 380 declined. The move was driven almost entirely by Apple, Microsoft, and Nvidia. For a trader building a watchlist, that reading changes everything: chasing breakouts in small- or mid-cap names on that day carries far more risk than the index move suggests.
One more distinction worth keeping in mind: intraday breadth and end-of-day (EOD) breadth serve different purposes. Intraday counts update tick-by-tick or on a one-minute cadence and are useful for reading short-term conviction during a session. EOD breadth feeds into cumulative indicators like the Advance-Decline line and is the standard input for regime-level analysis. Using intraday noise to make regime-level calls is one of the most common mistakes traders make.
Common breadth indicators traders rely on
Every breadth indicator answers a slightly different question. Knowing which tool to reach for — and when — is what separates useful market breadth analysis from information overload.
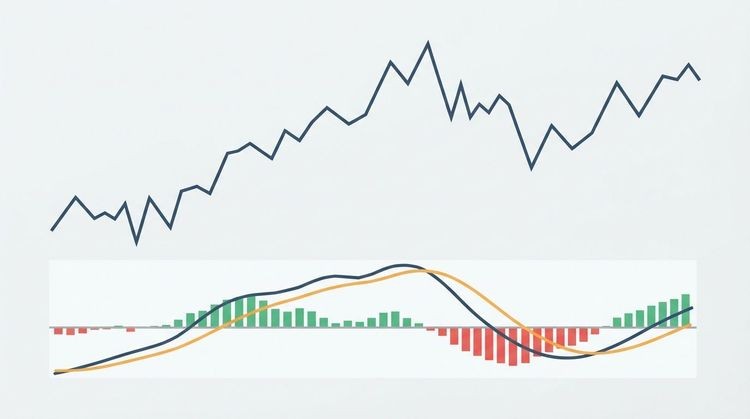
- Advance-Decline (A/D) Line: The most widely followed cumulative breadth tool. Each day, the net advances (advancing stocks minus declining stocks) are added to a running total. The A/D line confirms price trends when it moves with price and warns when it diverges. A rising index paired with a falling A/D line is one of the clearest structural warnings in technical analysis.
- Advance-Decline Volume Line: Instead of counting stocks, this version weights by volume. It answers whether the capital behind advancing stocks exceeds the capital behind declining ones. Volume-weighted breadth often reveals whether the majority of trading capital supports a move or whether a few names are doing all the heavy lifting.
- Net New Highs (New Highs minus New Lows): Tracks how many stocks are setting 52-week highs versus 52-week lows. When an index is at all-time highs but fewer stocks record new highs, the rally is losing underlying support and becomes fragile.
- Percent Above Moving Averages (20/50/200-day): Shows what share of index constituents trade above a specific moving average. A reading above 50% above the 200-day generally suggests broader long-term participation; sharp drops below common thresholds indicate weakening trend support.
- Arms Index (TRIN): Compares the advance/decline ratio to the up/down volume ratio. A TRIN below 1.0 suggests advancing stocks are attracting more volume, a bullish short-term signal; above 1.0 suggests the opposite. Extreme readings (above 2.0 or below 0.5) often mark short-term exhaustion points.
- McClellan Oscillator and Summation Index: The oscillator is a short-term momentum measure derived from the difference between two exponential moving averages of net advances. The Summation Index is its cumulative version, useful for identifying overbought and oversold conditions over weeks rather than days.
- Bullish Percent Index (BPI): Measures the percentage of stocks in a given index that are on Point & Figure buy signals. A BPI above 70% suggests an overbought market; below 30% suggests oversold conditions. It is slower-moving than the A/D line, making it better suited for regime analysis than short-term trading.
| Indicator | What it measures | Best timeframe |
|---|---|---|
| A/D Line | Cumulative net advances | Swing / regime |
| A/D Volume Line | Capital-weighted participation | Swing / intraday |
| Net New Highs | 52-week high/low spread | Regime |
| % Above 50-day MA | Short-term participation | Swing |
| % Above 200-day MA | Long-term participation | Regime |
| TRIN (Arms Index) | Volume conviction ratio | Intraday |
| McClellan Oscillator | Short-term breadth momentum | Intraday / swing |
| McClellan Summation | Cumulative breadth momentum | Regime |
| Bullish Percent Index | P&F buy-signal share | Regime |
For intraday decisions, TRIN and the McClellan Oscillator are your go-to tools. For swing trades and regime detection, the A/D line, percent-above-200-day, and net new highs give you the clearest picture. You can find a broader set of market indicators to pair with these breadth measures in your daily workflow.
How traders and analysts use breadth in live decision-making
Breadth is primarily a confirmation and risk-adjustment tool. It does not tell you when to buy or sell a specific stock; it tells you whether the environment supports the kind of trade you are considering.

Divergence is where breadth earns its reputation. Suppose the S&P 500 makes a new all-time high in late session, but the NYSE A/D line has been trending lower for two weeks. That divergence does not mean the market will reverse tomorrow, but it does mean the rally is being carried by fewer and fewer names. A trader’s rational response is to tighten stops on existing longs, reduce position size on new entries, and avoid chasing breakouts in names that are not leading the narrow advance.
Confirmation works the other way. When an index breaks to new highs and the A/D line is also at new highs, percent-above-50-day is above 65%, and net new highs are expanding, the move has broad structural support. That environment justifies larger position sizes and a more aggressive approach to continuation setups.
Regime detection is the highest-leverage use of breadth for most traders. Narrow breadth is a classic symptom of an aging bull market; indexes can keep rising while participation shrinks. When sustained narrow breadth persists for weeks, it signals that the market is becoming more stock-specific and less index-driven. Sector-neutral or market-neutral strategies tend to perform better in that environment than broad long exposure.
A practical example: imagine scanning for breakout setups on a day when the index is up 0.8%. Before adding any position, you check the A/D ratio and find it is 1.4:1 — slightly positive but not convincing. Percent-above-50-day has dropped from 62% to 54% over the past week. That context narrows your watchlist to only the strongest setups in leading sectors, and you cut your intended position size by a third. Breadth did not tell you what to buy; it told you how much risk to take.
How to calculate the main breadth metrics
Understanding the math behind these indicators lets you verify a data feed, build a custom spreadsheet, or spot errors in a vendor’s calculation.
Core formulas:
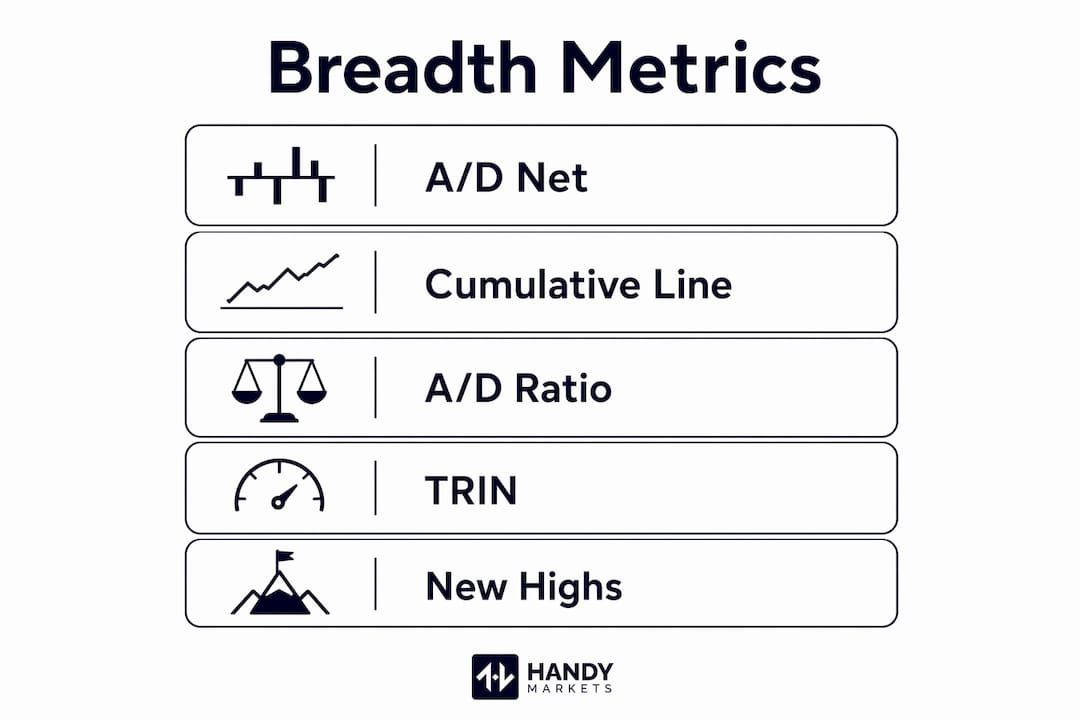
| Metric | Formula |
|---|---|
| A/D Net (daily) | Advancing stocks − Declining stocks |
| Cumulative A/D Line | Prior cumulative A/D + Today’s A/D Net |
| A/D Ratio | Advancing stocks ÷ Declining stocks |
| % Above 50-day MA | (Stocks above 50-day MA ÷ Total stocks) × 100 |
| Net New Highs | 52-week new highs − 52-week new lows |
| TRIN (Arms Index) | (Advancing ÷ Declining) ÷ (Up volume ÷ Down volume) |
| McClellan Oscillator | EMA of A/D Net − EMA of A/D Net |
Worked example — a single trading day:
Assume the NYSE reports the following at the close:
- Advancing stocks: a substantial majority
- Declining stocks: a smaller portion
- Unchanged stocks: some
- Up volume: roughly double the down volume
- 52-week new highs outnumber 52-week new lows
- Prior cumulative A/D line value: a large positive number
Step 1: A/D Net is positive
Step 2: Cumulative A/D Line rises

Step 3: A/D Ratio indicates more advancing than declining stocks
Step 4: TRIN suggests bullish volume conviction
Step 5: Net New Highs indicate healthy market expansion
This single day’s reading is bullish across all five measures. Now imagine the index is at a new high but the cumulative A/D line has been flat for three weeks while net new highs have shrunk to +12. That combination is the divergence pattern worth acting on.
A note on sampling: Intraday breadth counts are snapshots taken at a point in time during the session. They can swing sharply in the final 30 minutes of trading, which is why EOD figures are the standard input for cumulative indicators. If you are building a spreadsheet, always use official exchange-reported EOD advance/decline counts rather than mid-session snapshots for your cumulative A/D line. The data fields you need from any feed are: advance count, decline count, up volume, down volume, and 52-week new highs/lows.
Where to get breadth data and what to expect from different sources
Live breadth requires either a real-time market data feed or a dashboard that aggregates exchange counts as they update. EOD sources are cheaper and sufficient for regime analysis, but they cannot support intraday decisions.
Free EOD sources include publicly available exchange data and financial data APIs that publish daily advance/decline totals after the close. These are adequate for building cumulative A/D lines and tracking percent-above-MA on a daily basis, but they carry a 15-to-20-minute delay at best during the session.
Brokerage feeds give account holders real-time breadth data as part of their platform. The quality varies widely. Some brokers display only a simple A/D count; others provide full constituent-level data, volume breakdowns, and sector breadth panels. The limitation is that you are locked into the broker’s interface and alert system.
Commercial market-data vendors offer tick-level or one-minute breadth feeds with full constituent coverage, up/down volume, and historical data. These are the standard for professional traders but come with meaningful monthly costs.
SaaS dashboards sit between free tools and professional feeds. A practical four-panel approach — macro tape, market overview, sector heatmap, and global heatmap — gives you fast visual cues for breadth without requiring you to build your own data pipeline. The tradeoff is that you depend on the vendor’s data sourcing and update cadence.
Handy Markets provides live stock quotes and charts with per-asset monitoring across equities, ETFs, indices, and other asset classes, along with customizable multi-channel alerts via Telegram, Discord, Slack, SMS, Webhook, and Email. For traders who want to act on breadth signals the moment a threshold is crossed, that alert infrastructure is what makes real-time monitoring practical rather than theoretical. You can set up price alerts for individual constituents or index-level moves in minutes, without needing a professional data terminal.
Pro Tip: Three quick checks to validate any real-time breadth feed: (1) Compare the feed’s end-of-day A/D totals against the official NYSE or NASDAQ published figures — they should match exactly. (2) Pull up five or ten known tickers and confirm their advance/decline status matches their actual price change. (3) Verify that the feed’s volume aggregation method matches what the exchange reports — some vendors exclude pre-market and after-hours volume from their intraday totals, which can distort TRIN readings.
Common limitations and mistakes when using breadth
Breadth is context, not a timing signal. It can diverge from price for weeks or even months before the market resolves the discrepancy, which is why treating a single breadth reading as a sell signal is a reliable way to avoid exiting a trend prematurely.
The most common pitfall is ignoring volume. A day when 1,800 stocks advance but the advancing volume is only 40% of total volume tells a very different story than a day when 1,800 stocks advance and they account for 70% of volume. Volume-weighted breadth reveals whether capital flow supports a move or whether a few names are driving price action. Relying on count-only measures misses that distinction entirely.
A second mistake is using headline-weighted index breadth without checking equal-weighted or sector-weighted breadth. The S&P 500 is market-cap weighted, so its breadth statistics can look healthy even when mid- and small-cap participation is collapsing. Checking Russell 2000 breadth alongside S&P 500 breadth gives a more complete picture of whether strength is genuinely broad.
Short-term divergences are also frequently over-interpreted. Breadth is not a precise timing instrument; it should be combined with price structure and volume for reliable decisions. A one-week divergence in the A/D line during a strong uptrend is often just consolidation, not a structural breakdown.
Pro Tip: To avoid false alarms, require at least three breadth indicators to confirm a structural change before adjusting your overall market exposure. A reliable combination: the A/D line trending lower for two or more weeks, percent-above-200-day dropping below 45%, and net new highs turning negative while the index is near its highs. Any one of these alone is noise; all three together is a signal worth respecting.
A daily breadth checklist for active traders
A consistent morning routine turns breadth from an abstract concept into a practical edge. Here is a step-by-step sequence you can run in under ten minutes before the open, with sample alert thresholds to automate the monitoring.
- Check A/D net and cumulative trend. Look at yesterday’s A/D net and the direction of the cumulative A/D line over the past 10 and 20 sessions. Is the line trending with the index or diverging? A divergence of two or more weeks is worth flagging.
- Check percent above 50-day and 200-day MA. For S&P 500 constituents, readings above 60% above the 50-day suggest healthy short-term participation. A drop below 40% while the index holds near highs is a yellow flag. For the 200-day, a reading below 30% at index highs is a strong warning threshold.
- Evaluate net new highs vs new lows. If the index is within 2% of its all-time high but net new highs have turned negative (more new lows than new highs), the rally’s internal support is deteriorating.
- Check up/down volume and TRIN for intraday conviction. Before the open, review the prior session’s TRIN close. A TRIN above 1.5 at session end suggests selling pressure dominated volume. Intraday, a TRIN spike above 2.0 often marks a short-term capitulation low.
- Scan a sector breadth heatmap. Identify which sectors have the highest percent of advancing constituents. If only one or two sectors are driving the index, your watchlist should concentrate there — and your position sizing in other sectors should reflect the weaker participation.
Translating readings into watchlist actions:
- Expand new longs: A/D line at new highs, percent-above-50-day above 60%, net new highs expanding, TRIN below 0.85.
- Narrow new longs: A/D line flat or diverging, percent-above-50-day between 40–60%, net new highs shrinking.
- Pause new longs: A/D line in multi-week downtrend, percent-above-200-day below 30% at index highs, net new highs negative.
For alerting cadence, set intraday alerts for fast-moving liquidity events (TRIN spikes, sudden A/D ratio reversals) and EOD alerts for regime tracking (weekly A/D line direction, percent-above-200-day crossing key thresholds). A stock monitoring process that pairs this breadth routine with a broader market checklist keeps your workflow consistent without adding unnecessary complexity.
Key Takeaways
Breadth confirms or questions index moves — broad participation signals a healthy trend, while narrow participation signals a fragile one that deserves tighter risk management.
| Point | Details |
|---|---|
| Breadth confirms, not triggers | Use breadth to validate price action and adjust position sizing, never as a standalone buy or sell signal. |
| Volume weighting matters | Advance-Decline Volume and TRIN reveal capital conviction; count-only measures can miss the real story. |
| Watch leadership breadth at highs | When fewer stocks make new highs as the index climbs, the rally is losing internal support. |
| Require multiple confirmations | A structural change is credible only when A/D line, percent-above-200-day, and net new highs all align. |
| Handy Markets for live alerts | Handy Markets provides real-time stock monitoring and multi-channel alerts to act on breadth signals the moment thresholds are crossed. |
Breadth as a risk filter, not a crystal ball
The most useful reframe we can offer is this: stop asking breadth to predict the market and start asking it to size your risk. When breadth is strong, the environment rewards aggression. When breadth is narrowing, the environment punishes it.
In practice, we check the intraday A/D trend within the first 30 minutes of the session, validate it against percent-above-50-day, and then set a conditional alert for any rapid narrowing of breadth during the session. That routine has consistently flagged sessions where headline-driven breakouts looked compelling on price alone but were unsupported by participation. The result is not that we avoided every losing trade, but that we avoided taking full-size positions into fragile setups.
The traders who get burned by breadth are usually the ones who treat a two-day divergence as a regime change or who ignore volume entirely. Breadth is a slow-burning signal. It rewards patience and penalizes overreaction. Pair it with current stock market trends and a clear price structure, and it becomes one of the most reliable filters in your toolkit.
Real-time breadth monitoring with Handy Markets
Knowing what to watch is only half the equation. The other half is having a platform that delivers the data the moment it matters.
Handy Markets gives you live quotes and per-constituent monitoring across stocks, ETFs, and indices, with customizable alerts that fire the instant a breadth-relevant threshold is crossed. Whether you track percent-above-MA levels for S&P 500 constituents or want an immediate notification when a key index ETF breaks a critical level, the platform’s multi-channel alert system (Telegram, Discord, Slack, SMS, Webhook, and Email) means you are never watching a stale screen. Setting up your first alert takes under two minutes. Head to Handy Markets price alerts to configure your breadth thresholds now, or browse live stock quotes to start monitoring individual constituents in real time.
Useful sources and further reading
Use these references to go deeper on formulas, historical data, and breadth dashboards.
- Breadth of Market — Wikipedia: Clear foundational definition of breadth indicators and the advance/decline ratio; good starting point for understanding the math.
- Market Breadth 101 — StockCharts: Educational article on the A/D line, divergence patterns, and what index price alone misses. Type: educational article.
- Breadth Indicator: Overview, Examples, Limitations — Investopedia: Covers volume-weighted breadth, TRIN, and common limitations. Type: educational article.
- Market Breadth Dashboard — StockEducation: Free EOD breadth dashboard with A/D line, new highs/lows, and sector heatmaps. Type: free dashboard.
- What Is Market Breadth? — IG: Accessible explainer on percent-above-moving-average measures and how investors use them. Type: educational article.
- Handy Markets — Live Stocks, Alerts & Breadth Monitoring: Real-time stock quotes, charting, and multi-channel alert setup for per-constituent breadth tracking. Type: product page.
When building custom spreadsheets or alert rules, always validate your formulas against the official exchange-reported EOD advance/decline totals. Vendor calculations can differ in how they handle unchanged issues, ETFs, and preferred shares — knowing your source’s methodology prevents silent errors in your cumulative indicators.