TL;DR:
- Combining fundamental and technical analysis offers a more comprehensive and effective market insight.
- Different asset classes require tailored analysis approaches due to unique data and market forces.
- Disciplined, adaptable strategies and proper risk management are key to consistent trading success.
Most traders have been there: markets are moving fast, headlines are screaming, and the pressure to act feels overwhelming. Without a clear process, it is easy to chase momentum, ignore critical data, or make decisions based on gut instinct rather than evidence. Market analysis involves both fundamental and technical methods, and knowing how to apply each one systematically is what separates reactive traders from confident, informed investors. This guide walks you through a practical, step-by-step framework for analyzing stocks, crypto, forex, bonds, and commodities, so you can turn market uncertainty into a structured, repeatable edge.
Table of Contents
- Understand market analysis methodologies
- Step-by-step fundamental analysis for traders
- Step-by-step technical analysis process
- Apply analysis across asset classes
- A practitioner’s view: What most guides miss
- Take your market analysis further with Handy.Markets
- Frequently asked questions
Key Takeaways
| Point | Details |
|---|---|
| Master both analysis types | Combining fundamental and technical analysis gives you a practical edge across asset classes. |
| Adapt methods by asset | Tailor your analysis depending on whether you’re evaluating stocks, crypto, bonds, or commodities for best results. |
| Hybrid strategies outperform | Using a hybrid approach increases returns and reduces risk compared to relying on a single method. |
| Context drives decisions | Always check macro cycles and asset-specific factors before making buy, sell, or hold choices. |
| Verification beats guesswork | Verify your analysis steps and backtest strategies to offset market unpredictability. |
Understand market analysis methodologies
With the context established, let’s clarify the two main approaches that underpin market analysis. Every analysis decision you make traces back to one of two schools of thought, or ideally, a blend of both.
Fundamental analysis focuses on the intrinsic value of an asset. It asks: is this asset worth more or less than the market currently prices it? You examine financial statements, earnings growth, management quality, competitive position, and macroeconomic conditions. This approach suits long-term investors who want to hold positions for months or years.
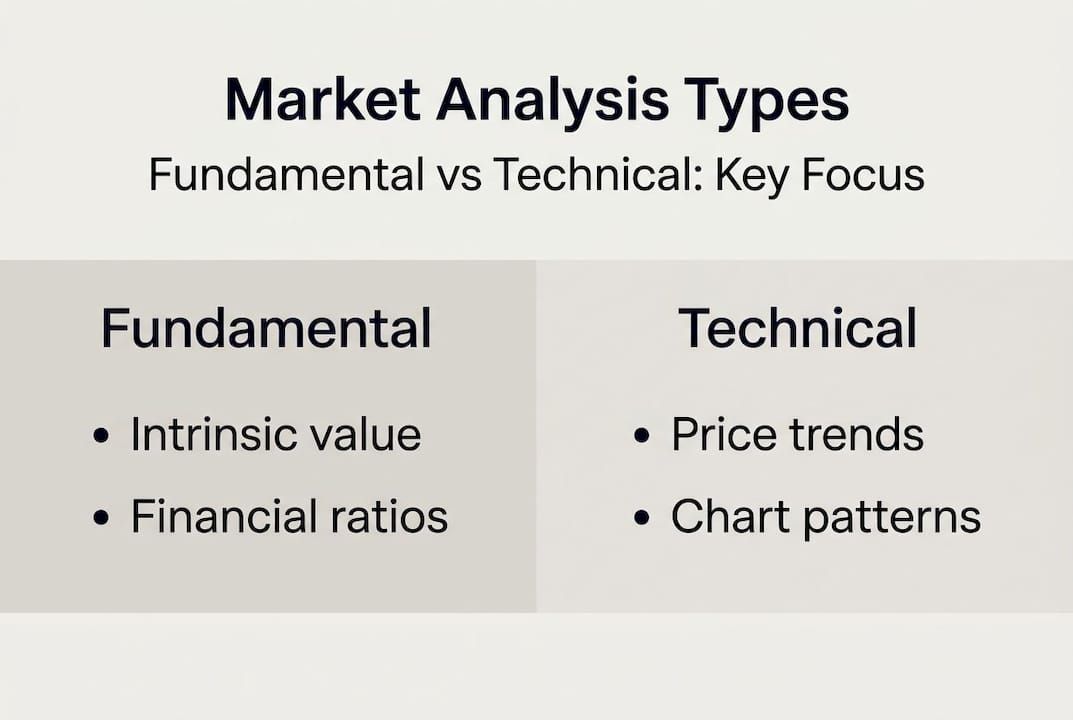
Technical analysis takes a different angle entirely. Rather than asking what an asset is worth, it asks where the price is likely to go next, based on historical patterns, volume, and momentum. Fundamental analysis evaluates intrinsic value, while technical analysis predicts movements via price patterns and indicators. Technical methods work best for short-term traders who need precise entry and exit timing.
The real edge comes from combining both. Hybrid approaches yield higher returns than relying on a single method. Use fundamentals to identify which assets deserve your attention, then use technicals to time your entry and exit.
| Factor | Fundamental analysis | Technical analysis |
|---|---|---|
| Time horizon | Long-term (months to years) | Short-term (days to weeks) |
| Data used | Financial statements, ratios | Price charts, volume, indicators |
| Core question | What is it worth? | Where is the price going? |
| Best for | Asset selection | Trade timing |
| Key tools | DCF, P/E, ROE | Moving averages, RSI, MACD |
When comparing financial markets across asset classes, you will notice that neither method dominates universally. The market analysis overview from professional sources consistently recommends that traders develop fluency in both. Think of it this way: fundamentals tell you what to buy, and technicals tell you when to buy it. Together, they form a far more complete picture than either approach alone. For a deeper look at how these tools evolve, explore market analysis techniques that experienced traders use today.
“The investor who says, ‘This time is different,’ when in fact it’s virtually a repeat of an earlier situation, has uttered among the four most costly words in the annals of investing.” — Sir John Templeton
Step-by-step fundamental analysis for traders
After understanding the frameworks, we move into the practical fundamental analysis process. This is where analysis becomes actionable.
- Define your goals and time horizon. Are you building long-term wealth or looking for a medium-term opportunity? Your goal shapes every subsequent step.
- Select your asset. Choose a company, sector, or industry based on initial screening criteria like revenue growth or market position.
- Review financial statements. Examine the income statement, balance sheet, and cash flow statement. Look for consistent revenue growth, manageable debt, and positive free cash flow.
- Calculate key ratios. These numbers give you an objective snapshot of financial health.
- Conduct a qualitative assessment. Evaluate leadership quality, competitive advantages, regulatory environment, and macro tailwinds or headwinds.
- Estimate intrinsic value. Use discounted cash flow (DCF) modeling or comparable company analysis to arrive at a fair value estimate.
- Compare intrinsic value to market price. If the market price is significantly below intrinsic value, you may have found an opportunity. If it is above, proceed with caution.
This stepwise fundamental analysis process is endorsed by professional analysts and covers goals, statements, ratios, qualitative factors, and valuation review. For a broader view of how these steps connect to market trends, mastering market trends offers practical context.

| Ratio | What it measures | Healthy benchmark |
|---|---|---|
| P/E (Price-to-Earnings) | Valuation relative to earnings | 10-25x (sector-dependent) |
| EPS (Earnings Per Share) | Profitability per share | Positive and growing |
| ROE (Return on Equity) | Efficiency of shareholder capital | Above 15% |
| Debt-to-Equity | Financial leverage | Below 1.0 for most sectors |
| Free Cash Flow | Cash generation after capex | Consistently positive |
Pro Tip: Always cross-reference the income statement, balance sheet, and cash flow statement together. Cross-referencing financial statements can detect manipulation that appears clean in any single document. Inconsistencies between net income and cash flow, for example, are a classic red flag worth investigating before you commit capital. You can also use market fluctuation analysis tools to monitor how macro shifts affect the ratios you track.
Step-by-step technical analysis process
Having established fundamentals, let’s shift to the technical analysis workflow. Where fundamental analysis is about value, technical analysis is about behavior, specifically, how traders collectively push prices in predictable patterns.
- Identify the trend. Use 50-day and 200-day moving averages to determine whether an asset is in an uptrend, downtrend, or sideways range. A price above both averages typically signals bullish momentum.
- Map support and resistance levels. These are price zones where buying or selling pressure historically concentrates. They act as natural targets and stop-loss anchors.
- Recognize chart patterns. Patterns like head and shoulders, flags, and double bottoms signal potential reversals or continuations. Technical trading patterns provide a reliable visual language for price behavior.
- Confirm with volume and momentum indicators. A breakout with rising volume is far more trustworthy than one on thin volume. RSI (Relative Strength Index) and MACD (Moving Average Convergence Divergence) help confirm momentum.
- Define your entry with confluence. The strongest signals occur when multiple indicators align. For example, price breaking resistance, RSI above 50, and volume surging together.
- Set your stop-loss and profit target. A practical rule: place stops at 1.25x the Average True Range (ATR) below your entry. This accounts for normal volatility without getting stopped out prematurely.
- Manage the position actively. Use trailing stops to lock in gains as price moves in your favor, and adjust profit targets based on evolving market conditions.
This stepwise technical analysis workflow covers trend lines, support/resistance, patterns, indicators, entry signals, and trade management. Hybrid strategies outperform univariate approaches, especially in short-term trading. For a curated overview, explore stock market indicators that beginners find most useful.
Most useful technical indicators for beginners:
- Moving averages (50/200-day): Trend direction and momentum
- RSI: Identifies overbought or oversold conditions
- MACD: Signals trend changes and momentum shifts
- Bollinger Bands: Measures volatility and potential breakouts
- Volume: Confirms the strength of any price move
Pro Tip: Be cautious in range-bound, low-volatility markets. False breakouts are common when price oscillates between support and resistance without a clear trend. Your volatility checklist should always include a step for confirming whether a trend actually exists before applying trend-following strategies. Check top investment strategies for guidance on adapting your approach to different market conditions.
Apply analysis across asset classes
With individual methods covered, let’s see how analysis adapts across diverse asset classes. Markets are not monolithic. Each asset class has its own heartbeat, driven by different forces.
Asset classes require different focus: stocks rely on financials, crypto and forex blend technical and macro factors, bonds track yield curves, and commodities follow cycles and supply/demand dynamics. Intermarket analysis across stocks, bonds, and commodities matters especially in volatile periods like 2026.
| Asset class | Primary analysis type | Key data sources | Unique challenge |
|---|---|---|---|
| Stocks | Fundamental + technical | Earnings, ratios, charts | Sector rotation timing |
| Crypto | Technical + macro + on-chain | Price data, blockchain metrics | Extreme volatility, low liquidity |
| Forex | Technical + macro | Interest rates, economic data | Geopolitical sensitivity |
| Bonds | Macro + credit analysis | Yield curves, credit ratings | Interest rate risk |
| Commodities | Supply/demand + cycles | Inventory reports, seasonality | Weather and geopolitical shocks |
Unique challenges by asset class:
- Stocks: Earnings surprises can override any technical setup overnight
- Crypto: On-chain data (wallet flows, exchange reserves) adds a layer most traders ignore
- Forex: Central bank policy shifts can invalidate weeks of technical analysis in minutes
- Bonds: Yield curve inversions signal recessions but with unpredictable timing
- Commodities: Seasonal cycles and geopolitical events drive short-term dislocations
Using market data trends helps you stay current on how each class is behaving in real time. For hands-on monitoring across all these markets, tracking financial markets in one place gives you a significant informational advantage.
A practitioner’s view: What most guides miss
Armed with practical frameworks, let’s examine what experienced traders do differently and how the current market climate shifts priorities.
Most analysis guides present methods as if markets are stable, rational, and consistent. They are not. In 2026, market dispersion emphasizes asset-level analysis over passive indexing, meaning that broad market signals are less reliable than ever. Individual assets are moving on their own stories, not just macro tides.
Here is the uncomfortable truth: complex ML models often fail in efficient or high-volatility markets, and simple approaches sometimes outperform them. A straightforward moving average crossover, consistently applied with disciplined risk management, can outperform an elaborate algorithmic system that overfits historical data.
What actually separates consistent traders from the rest? Journaling every trade, backtesting every strategy before risking real capital, and staying flexible enough to abandon a method when market conditions shift. Rigidity is the real enemy of performance.
Pro Tip: Always cross-check your fundamental and technical conclusions before acting. Markets in high volatility environments reward those who adapt quickly, not those who cling to a single model. Treat your analysis framework as a living document, not a fixed rulebook.
Take your market analysis further with Handy.Markets
Now, connect your stepwise analysis with actionable tools that streamline market research. Having a solid framework is only half the equation. The other half is having the right data, delivered at the right moment.
Handy.Markets gives you live financial market tracking across stocks, crypto, forex, commodities, and indices, all in one place. You can monitor price movements, spot trend shifts, and set up price alert tools across Telegram, Discord, Slack, SMS, and Email so you never miss a critical signal. Whether you are running fundamental screens or watching technical breakouts, live stock price alerts keep your analysis connected to real-time market action. It is the practical layer that turns your research into timely, confident decisions.
FAQ
How much time should I spend on fundamental analysis per asset?
Professional fundamental analysis typically takes 5 to 10 hours per company for a thorough evaluation. Beginners may need more time initially as they build familiarity with financial statements and valuation models.
Is technical analysis useful for long-term investing?
Fundamental analysis suits long-term asset selection, while technical analysis is more effective for short-term timing. Long-term investors can still use technicals to optimize their entry points rather than buying blindly.
What is the key advantage of using a hybrid analysis approach?
Hybrid strategies yield monthly returns of 1.12 to 3.31%, compared to 0.48 to 1.30% for single-method approaches. This consistent outperformance makes the hybrid model worth the extra analytical effort.
How should I adapt market analysis for crypto or forex versus stocks?
For crypto or forex, blend technical and macro analysis along with on-chain data where available. For stocks, prioritize financial fundamentals like earnings quality, competitive moats, and valuation ratios.
Why do complex models sometimes underperform simple strategies?
In efficient or low-predictability markets, naive forecasts outperform complex models because overfitting historical data creates fragility when conditions change. Simplicity and consistency often prove more durable than sophistication.
Recommended
- Market Analysis Techniques 2026: Advanced Approaches For Analysts | Handy.Markets
- Mastering Market Trends: 13% Annual Returns Proven Strategy | Handy.Markets
- Market Fluctuation Analysis: Methods, Tools & Strategies | Handy.Markets
- Stock Market Indicators: Essential List For Smarter Trading | Handy.Markets