TL;DR:
- Real-time data interpretation relies on reliable devices, platforms, alerts, and understanding key terms.
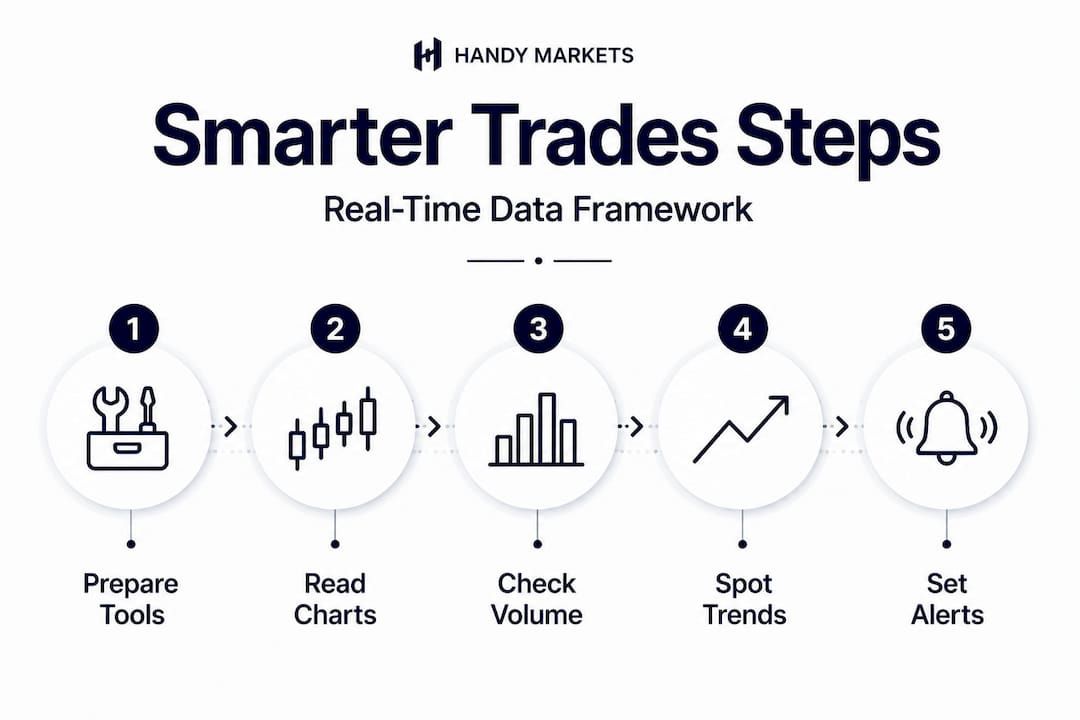
- A structured four-step framework helps traders analyze price, volume, indicators, and market context.
- Using alert systems and confluence of signals across higher timeframes improves decision accuracy.
Picture this: Bitcoin surges 12% in forty minutes while you’re staring at a static chart from two hours ago. Or a commodity you’ve been watching breaks a key support level, but your alert never fires because it wasn’t configured properly. By the time you notice, the move is over and the opportunity is gone. Real-time financial data is the heartbeat of active trading, and knowing how to read that pulse accurately means the difference between acting with confidence and reacting too late. This guide walks you through the practical skills, tools, and alert strategies that help you interpret live market signals across crypto, stocks, and commodities.
Table of Contents
- What you need to interpret real-time financial data
- Step-by-step: How to analyze price, volume, and trend in real time
- Making better decisions: Using indicator confluence and higher timeframes
- Asset class nuances: Interpreting real-time data in crypto, stocks, and commodities
- A smarter perspective: Why actionable alerts—not more data—create the edge
- Empower your trading with real-time data and smart alerts
- Frequently asked questions
Key Takeaways
| Point | Details |
|---|---|
| Multiple signals matter | Relying on confluence of indicators and higher timeframes improves your trade outcomes. |
| Volume validates moves | Strong price trends show increasing volume; weak volume warns of short-lived changes. |
| Customize by asset | Adjust interpretation and alert settings for each asset class due to different volatility patterns. |
| Alerts drive action | Configurable real-time alerts are key to making timely, effective trading decisions. |
What you need to interpret real-time financial data
Now that you understand why timely interpretation makes such a difference, let’s clarify what every trader needs before diving deeper.
Before you can confidently read a live chart, you need the right foundation. Think of it like tuning an instrument before a performance. Without the proper setup, even the best data stream turns into noise. Start with an intro to real-time data to understand the mechanics before building your toolkit.
Core requirements every trader needs
Here is a breakdown of the essentials:
| Requirement | What it does | Why it matters |
|---|---|---|
| Reliable device | Displays live charts and data | Lag kills trades |
| Data platform | Aggregates real-time prices | Accuracy is everything |
| Alert system | Notifies on price levels | Removes emotional guessing |
| Chart software | Visualizes OHLC, volume | Enables pattern recognition |
| Internet connection | Keeps data stream live | Delays distort signals |
Beyond hardware and software, you need familiarity with a few key terms. OHLC stands for Open, High, Low, and Close: these four price points form every candlestick on a chart and tell the story of how a market behaved over any given period. Bid-ask spread is the gap between what buyers will pay and what sellers will accept, and tight spreads generally indicate healthy liquidity. Tick data is the most granular form of price information available, capturing every single transaction in real time.
On the indicator side, technical indicators like RSI (overbought above 70, oversold below 30), MACD, and moving averages are used on real-time data for momentum and trend analysis across stocks, commodities, and forex. These tools help you understand not just where price is, but where it might be heading and how much conviction stands behind that move.
Here’s a quick reference for the most used indicators:
- RSI (Relative Strength Index): Measures momentum and identifies overbought or oversold conditions.
- MACD (Moving Average Convergence Divergence): Signals trend direction and potential reversals through two moving average lines.
- Simple Moving Average (SMA): Smooths out price data to show the average price over a set period, filtering short-term noise.
- Exponential Moving Average (EMA): Weights recent prices more heavily, making it more responsive to current market conditions.
- Volume: Not an indicator in the traditional sense, but arguably the most important confirmation tool you have.
Pro Tip: Prioritize platforms that offer configurable real-time alerts tied directly to indicator thresholds. Being able to define your own RSI or moving average crossover trigger means your platform does the watching so you can focus on decision-making rather than screen time. You can also explore strategies for following live market prices to complement your setup.
Step-by-step: How to analyze price, volume, and trend in real time
Once you’ve got your essential tools and basic setup ready, here’s the framework to follow each time you interpret real-time charts.
A structured process removes emotion from the equation. When markets are moving fast, you don’t want to be improvising. Follow this repeatable sequence every single time you sit down to read live data.
The four-step interpretation framework
- Observe price action using OHLC and tick charts. Start with the current candle. Where did price open? Where is it now relative to the high and low of the session? Tick charts, which plot every transaction rather than fixed time intervals, are especially useful in fast-moving conditions like crypto volatility spikes or pre-market stock gaps. They reveal microstructure that time-based charts miss entirely.
- Examine volume alongside price. Volume is your lie detector. According to stock chart analysis, rising price on rising volume indicates a strong trend, while rising price on falling volume signals weakness. This distinction is critical. A price surge without volume behind it is often a false breakout, luring traders in right before a reversal.
- Cross-check your key indicators. Once you’ve assessed price and volume, layer in your indicators. Is the RSI confirming overbought conditions that match a resistance zone you’ve identified? Is the MACD histogram shrinking, suggesting momentum is losing steam? Indicators work best when they corroborate what price and volume are already telling you, not when they’re used in isolation.
- Apply market fluctuation analysis to contextualize the move. Always ask: is this move part of a larger trend, or is it a short-term reaction? Zooming out to a higher timeframe, even briefly, helps you distinguish between meaningful shifts and temporary noise.
Quick-reference chart signals table
| Signal | What it looks like | What it may imply |
|---|---|---|
| Rising price, rising volume | Candles closing higher, volume bar growing | Strong bullish trend |
| Rising price, falling volume | Price climbing but bars shrinking | Potential fake breakout |
| Falling price, rising volume | Candles dropping, bars expanding | Strong bearish pressure |
| RSI above 70 | Indicator line in upper zone | Overbought, watch for reversal |
| MACD crossover (bullish) | Fast line crosses above slow line | Possible upward momentum shift |
| Price at key moving average | Candle touches 50 or 200 SMA | Potential support or resistance |
“Volume confirms price moves: rising price on rising volume indicates a strong trend; rising price on falling volume signals weakness.” This single principle has saved countless traders from chasing false breakouts.
Practice this framework on a watchlist of five to ten assets. Repetition builds pattern recognition faster than any course or tutorial.
Making better decisions: Using indicator confluence and higher timeframes
Now that you understand the mechanics of reading price and volume, it’s time to upgrade your decision-making with more advanced, reliable methods.

Confluence means two or more independent signals pointing in the same direction at the same time. When your RSI reads oversold and price is sitting on a major moving average and volume is picking up, that’s confluence. Any one of those signals alone is weak. Together, they create a much higher probability scenario.
This matters because multiple indicators and higher timeframe trends create higher probability setups, and no single indicator is reliable alone. Markets are too dynamic, too influenced by news, sentiment, and liquidity flows, for any one tool to consistently deliver an edge.
Top indicators and alert combinations for each asset class
- Crypto: RSI plus volume on 1-hour and 4-hour charts, combined with open interest (OI) data to gauge whether new money is entering a move.
- Stocks: 50-day and 200-day moving averages combined with RSI and earnings-related volume spikes.
- Commodities: MACD plus volume breakouts, cross-referenced with news-driven price gaps on daily charts.
- Forex: RSI combined with Bollinger Bands and session-specific volume patterns.
Visit the list of key trading indicators to build your personalized indicator stack based on your preferred markets and trading style.
Callout: No single indicator should ever be the sole reason you enter or exit a position. The market will always find a way to fool a one-signal trader.
Higher timeframes act as powerful filters for lower timeframe noise. If the daily chart shows a strong uptrend with price well above the 200-day moving average, then a short signal on a 5-minute chart deserves much more skepticism. The bigger picture provides context that protects you from acting on signals that look compelling in isolation but are swimming against a much stronger current. Learn more about mastering market trends to develop a timeframe-aware trading mindset.
Technical indicators like RSI, MACD, and moving averages work across asset classes, but their reliability increases significantly when you’re applying them in the direction of the higher timeframe trend rather than against it.
Pro Tip: Set your price alerts based on multi-indicator setups, not just price levels. For example, trigger an alert when price touches a moving average and RSI is below 35. This kind of conditional awareness keeps you out of whipsaw trades where a single threshold gets tagged momentarily without any real follow-through.
Asset class nuances: Interpreting real-time data in crypto, stocks, and commodities
Your interpretation skills reach their full potential when adapted to the quirks of each market. Here’s how to tailor your approach.
Every asset class has its own personality. Crypto moves like a sprinter, commodities react like a weather system, and stocks tend to behave more like a long-distance runner with occasional bursts. Understanding those differences protects you from applying the wrong parameters to the wrong market.
Crypto
Cryptocurrency markets never sleep and volatility can be extreme. A 5% move in an hour is unremarkable for Bitcoin; the same move in a blue-chip stock would be headline news. Crypto and commodities require volatility-adjusted thresholds due to higher swings compared to stocks, and you should actively monitor flows and open interest for microstructure signals.
- Set wider alert thresholds (for example, 3% to 5% rather than 1%) to avoid constant noise.
- Monitor open interest alongside price. Rising OI with rising price suggests new buyers are entering, lending strength to the move.
- Check crypto live data regularly to stay calibrated to current volatility conditions.
Commodities
Commodities react sharply to news events: weather reports, geopolitical tensions, supply chain disruptions, and inventory data can each cause sudden, significant price spikes. Volume during these spikes tends to expand dramatically and then contract, so timing matters enormously.
- Evaluate volume spikes in context. A volume surge driven by a one-time news event is different from sustained accumulation.
- Adjust alert parameters around known report release times (like USDA crop reports or EIA petroleum data).
- Use commodities live charts to track these events in real time.
Stocks
Stocks generally offer more predictable behavior, especially for large-cap names with deep liquidity. Moving averages and RSI thresholds are typically more reliable here because price tends to respect technical levels better when order flow is consistent.
- The 50-day and 200-day SMAs are widely watched by institutional traders, making them self-fulfilling levels of support and resistance.
- RSI readings above 70 or below 30 on a daily stock chart carry more weight than the same readings on a 5-minute crypto chart.
- Earnings season introduces stock-specific volatility. Recalibrate your settings ahead of earnings dates.
Monitor data trends in different markets to stay ahead of structural shifts in each asset class’s behavior.
Pro Tip: Recalibrate your indicator settings and alert thresholds every time you switch between asset classes. Using the same RSI level or the same percentage alert for both Bitcoin and a utility stock is a recipe for false signals and missed opportunities.
A smarter perspective: Why actionable alerts—not more data - create the edge
With those distinctions in mind, let’s close with a perspective that challenges how most traders think about real-time data.
Most new traders believe the solution to missing opportunities is accessing more data. More indicators. More news feeds. More charts open at once. We’ve watched this trap play out repeatedly, and we’ll say it plainly: information overload is one of the biggest threats to clear trading decisions.
The traders who consistently perform well are not the ones staring at ten monitors. They’re the ones who have simplified their process to a handful of genuinely useful signals and, critically, built alert systems that notify them the moment those exact conditions are met. Data without a response mechanism is just noise with a price tag.
Alerts convert passive observation into active, practical action. When you set up a properly configured alert, you’re essentially telling the market: “When this specific condition occurs, tell me immediately.” That kind of intentional attention is far more powerful than watching price tick up and down in real time, which activates emotional responses that erode decision quality.
We also believe that clarity of process beats complexity of analysis every time. A trader who follows five rules consistently will outperform one who knows fifty indicators but applies them inconsistently. Prioritize simplicity and clarity over stacking more tools. When your setup is simple enough to explain in one sentence, it’s probably robust enough to execute under pressure.
As we like to say internally: “Data is only as powerful as the decisions it enables.” The market will always produce more information than any human can process. Your edge comes from filtering aggressively, acting on actionable market alerts, and staying consistent rather than chasing every signal that flickers across your screen.
Empower your trading with real-time data and smart alerts
If you’re ready to apply these lessons, here’s how Handy.Markets can give you a practical edge. Whether you trade crypto, stocks, or commodities, having everything in one place, live prices, percentage changes, trend signals, and a notification system, transforms how quickly and confidently you respond to market moves.
Handy.Markets lets you track markets with alerts across all major asset classes without the complexity of stitching together multiple tools. You can set up price alerts in minutes through Telegram, Discord, Slack, SMS, Webhook, or Email, ensuring you’re notified the moment your specific conditions are triggered. Stop chasing price. Let the alerts come to you, calibrated to your strategy, your risk tolerance, and your preferred assets.
FAQ
What is the best indicator for real-time trading signals?
No single indicator is reliable on its own. Use a confluence of multiple indicators alongside higher timeframe trend context to reach higher-probability setups.
How do I set effective price alerts for volatile markets?
Set wider thresholds and combine volume or flow data, since crypto and commodities require volatility-adjusted alert parameters due to their larger price swings compared to stocks.
How can volume confirm a price move in real time?
Rising price on rising volume confirms trend strength, while price climbing on shrinking volume suggests the move may stall or reverse.
Are technical indicators useful for all asset classes?
Yes. RSI, MACD, and moving averages apply across stocks, forex, crypto, and commodities, but you must adapt thresholds and sensitivity settings for each asset’s typical volatility range.
Recommended
- Market Monitoring Guide: Real-Time Alerts For Traders | Handy.Markets
- Stock Market Indicators: Essential List For Smarter Trading | Handy.Markets
- How To Follow Live Market Prices: Real-Time Strategies | Handy.Markets
- How To Compare Financial Markets: A Guide For Investors | Handy.Markets
- How to read an income statement for smarter decisions | Ready Accounting