TL;DR:
- Price action reflects real-time market behavior and forms the foundation of all technical analysis.
- Traders use candlestick patterns, support zones, and trend structure to read charts and identify high-probability setups.
Price action is defined as the movement of a security’s price plotted over time, forming the raw data behind every technical analysis decision. Unlike lagging indicators that process historical data before delivering a signal, price action shows you what the market is doing right now. Traders who understand price action read charts directly, spotting patterns in candlesticks, support zones, and trend structure without waiting for a moving average to catch up. This guide breaks down the core concepts, practical strategies, and risk management rules you need to trade with confidence.
What is price action and why does it matter?
Price action is the foundation of technical analysis. Every chart pattern, every indicator, and every trading signal ultimately derives from raw price data. Algorithmic trading systems use price action data to identify trends and execute trades automatically, which confirms that this approach is not limited to discretionary human traders. The market’s price behavior reflects the collective decisions of every buyer and seller, making it the most direct window into market psychology available.

The price action trading definition separates it clearly from indicator-based analysis. Indicators like RSI or MACD are calculated from price, meaning they always lag behind it. Price action analysis works with the source data directly. This gives traders faster signals and a cleaner view of what is actually happening at key market levels.
Understanding price action also builds a skill that transfers across markets. Whether you trade forex, stocks, commodities, or crypto, the same candlestick patterns and structural concepts apply. That universality makes price action one of the most durable skills in a trader’s toolkit.
What are the basic components of price action trading?
Price action analysis relies on a small set of core tools. Learning these well gives you a complete framework for reading any chart.
Candlestick patterns and what they reveal
A single candlestick contains four data points: the open, high, low, and close. The body shows the distance between open and close. The wick shows how far price traveled beyond that range before reversing. A long upper wick on a bullish candle signals rejection at higher prices, a warning that sellers pushed back hard.
Two patterns stand out for their reliability:
- Pin bars: A small body with a long wick. The wick shows where price was rejected. A bearish pin bar at resistance signals a likely reversal downward.
- Engulfing candles: One candle’s body completely covers the previous candle’s body. A bullish engulfing pattern at support signals strong buying pressure.
- Inside bars: A candle whose high and low sit within the previous candle’s range. This signals consolidation and a potential breakout in either direction.
- Doji candles: Open and close are nearly equal, creating a cross shape. This signals indecision and often precedes a reversal when it appears at a key zone.
Support, resistance, and market structure
Price action traders use zones rather than exact price lines for support and resistance, typically around 20–30 pips on major currency pairs. Zones account for the natural volatility of price as it tests a level. Drawing a single line and expecting price to reverse at that exact point sets you up for unnecessary stop-outs.
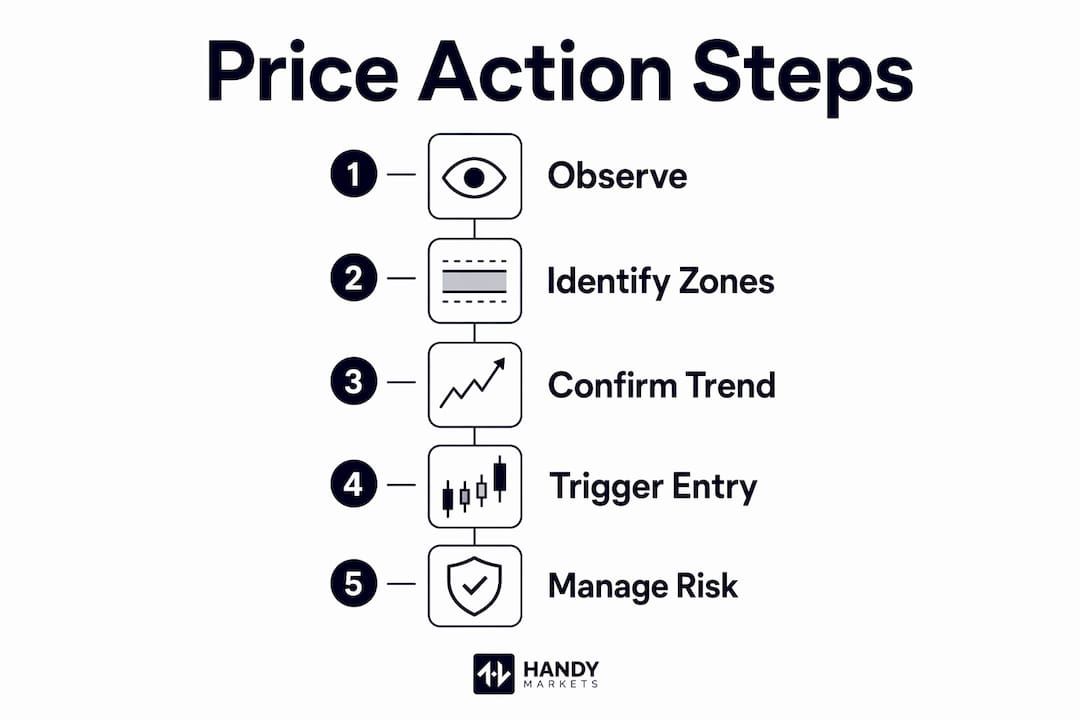
Market structure ties these zones together. An uptrend produces higher highs and higher lows. A downtrend produces lower highs and lower lows. Swing points mark where price reversed, and those reversal levels become your key zones for future trades.
Pro Tip: Identify your zones on the daily chart first. Then drop to a lower timeframe to find your trigger candle. This top-down approach keeps your trades aligned with the dominant trend.
How do traders confirm trends and identify trade setups?
Trend confirmation is the first filter every price action trade must pass. A trade taken against the dominant trend has a lower probability of success, regardless of how clean the setup looks.
- Map the swing structure. Mark the most recent swing highs and swing lows on your chart. If each new high is higher than the last and each new low is higher than the last, the trend is up.
- Assess impulse versus corrective moves. A trend is structurally sound when impulse moves are larger and stronger than corrective moves. If corrections start matching impulse waves in size, the trend is weakening.
- Locate a key zone. Find a support zone in an uptrend or a resistance zone in a downtrend. This is where you wait for your entry signal.
- Wait for a trigger candle. A pin bar, engulfing candle, or strong rejection candle at your zone confirms that price has tested the level and buyers or sellers have responded.
- Confirm alignment with the dominant trend. Only take the trade if the trigger candle points in the same direction as the trend you identified in step one.
Mastering trend direction through this structural approach removes most of the guesswork from entry timing. The goal is not to predict every move. The goal is to find high-probability setups where structure, zone, and trigger all align.
Pro Tip: If the corrective waves in a trend start producing their own higher highs and higher lows, that is a reversal signal, not just a pullback. Reassess your bias before entering.
What are effective price action strategies and how to set risk-reward targets?
Three core strategy types cover most price action setups you will encounter.
- Breakout trades: Price consolidates near a resistance zone, then closes above it with conviction. Enter on the breakout candle’s close or on a retest of the broken level. Stop goes below the consolidation zone.
- Reversal trades: Price reaches a major support or resistance zone and prints a strong rejection candle. Enter in the opposite direction. Stop goes just beyond the zone’s outer boundary.
- Continuation trades: Price pulls back to a support zone within an established uptrend, then prints a bullish trigger candle. Enter long. Stop goes below the pullback low.
Setting realistic risk-reward targets
A minimum net risk-reward ratio of 1:2 is the standard starting point for price action trades. This means your potential profit is at least twice your potential loss. However, that 1:2 ratio on the chart often shrinks in practice. The commonly advised 1:2 ratio reduces to about 1:1.3 after accounting for spreads, slippage, and swap fees. That adjustment matters enormously for your long-term profitability.
| Strategy type | Entry trigger | Stop placement | Realistic net R:R |
|---|---|---|---|
| Breakout | Close above resistance zone | Below consolidation low | ~1:1.5 after costs |
| Reversal | Rejection candle at major zone | Beyond zone outer boundary | ~1:1.3 after costs |
| Continuation | Trigger candle at pullback zone | Below pullback low | ~1:1.5 after costs |
For risk management best practices, never risk more than 1%–2% of your account on a single trade. Consistent position sizing protects your capital during losing streaks, which every trader experiences regardless of skill level.
How does volume enhance price action trading effectiveness?
Volume is the single most underused confirmation tool in price action analysis. Strong price movement on low volume is less reliable than the same move backed by high trading volume. A breakout candle that closes above resistance on three times the average volume carries far more weight than one that barely clears the level on thin activity.
Volume adds conviction to price moves and helps avoid false signals. This is especially true during breakouts, where low-volume moves frequently reverse back into the range. Checking volume before entering a breakout trade takes seconds and can save you from a costly false breakout.
Hybrid approaches that professional traders use
Many traders who claim to trade pure price action actually apply filters to reduce noise. Experienced price action traders use filters such as only trading long when price is above the 200-period EMA. This single rule eliminates a large number of counter-trend trades that look valid on the chart but fail because the broader trend is down.
The ADX indicator serves a similar filtering role. When ADX reads above 25, a trend is present and continuation setups carry higher probability. When ADX reads below 20, the market is ranging and breakout setups become unreliable.
- EMA(200) filter: Only take long setups when price is above the 200-period EMA. Only take short setups when price is below it.
- ADX filter: Require ADX above 25 before entering trend-following trades.
- Volume filter: Require above-average volume to confirm breakout candles.
For deeper context on why volume context matters when evaluating price signals, the relationship between volume and price conviction is well documented across asset classes. Combining these filters with clean price action setups creates a hybrid method that reduces emotional bias and keeps your trades aligned with market reality. You can also interpret real-time data alongside price structure to sharpen your read on developing setups.
Key Takeaways
Price action trading works best when structure, zone, trigger, and trend direction all align before you enter a trade.
| Point | Details |
|---|---|
| Price action defined | It is the raw movement of a security’s price over time, forming the base of all technical analysis. |
| Zones beat exact lines | Use 20–30 pip zones for support and resistance to handle natural price volatility at key levels. |
| Trend confirmation first | Confirm higher highs and higher lows before entering any long trade; reverse for short setups. |
| Adjust your R:R for costs | A 1:2 ratio on the chart often becomes 1:1.3 net after spreads, slippage, and swap fees. |
| Volume confirms conviction | Strong moves on high volume are reliable; strong moves on low volume frequently reverse. |
The honest truth about price action that most guides skip
At Handy Markets, we have watched traders pick up price action concepts quickly and then struggle for months before they trade them consistently. The gap is almost never knowledge. It is discipline.
Price action analysis is inherently subjective. Two traders can look at the same pin bar and disagree on whether it qualifies as a valid setup. The way to close that gap is to write down your rules before you trade, not after. Define what a valid zone looks like. Define what a valid trigger candle looks like. Then follow those rules without exception for at least 50 trades before you evaluate results.
The hybrid approach changed how we think about pure price action. Adding the EMA(200) as a directional filter did not make the method more complicated. It made it cleaner. Counter-trend setups that used to tempt us simply disappeared from consideration. That one filter reduced our trade frequency and improved our win rate at the same time.
The traders who treat price action as a magic formula burn out fast. The traders who treat it as a structured reading skill, one that improves with deliberate practice and honest review, build something durable. Start with the daily chart, master your zones, and let the trigger candle do the work.
Real-time tools that support your price action practice
Price action analysis depends on clean, current data. Watching a price level develop in real time is a different experience from reviewing it after the fact.
Handy Markets gives you live prices and alerts across crypto, stocks, forex, indices, and commodities in one place. When price approaches a key zone you have identified, a custom price alert on Telegram, Discord, Slack, or SMS puts you at your chart at exactly the right moment. You do not need to watch screens all day. You set the level, and Handy Markets tells you when price arrives. That kind of discipline support is what separates traders who execute their plan from those who miss setups or chase entries.
FAQ
What is price action in simple terms?
Price action is the study of how a security’s price moves over time on a chart. Traders use it to make decisions based on raw price behavior rather than calculated indicators.
What are the most reliable price action patterns?
Pin bars, engulfing candles, and inside bars are the most widely used price action patterns. Their reliability increases significantly when they form at a key support or resistance zone aligned with the dominant trend.
How do I use price action to confirm a trend?
Confirm an uptrend by identifying a series of higher highs and higher lows on your chart. A trend is structurally sound when impulse waves are larger than corrective waves.
Do I need indicators to trade price action?
Indicators are not required, but filters like the 200-period EMA help reduce noise and emotional bias. Many professional traders use a hybrid approach that combines clean price action setups with one or two objective filters.
What risk-reward ratio should I target with price action trades?
Start with a minimum 1:2 risk-reward ratio on the chart, but account for execution costs. In practice, spreads and slippage reduce that ratio to approximately 1:1.3 net, so your win rate must be high enough to remain profitable at that adjusted figure.