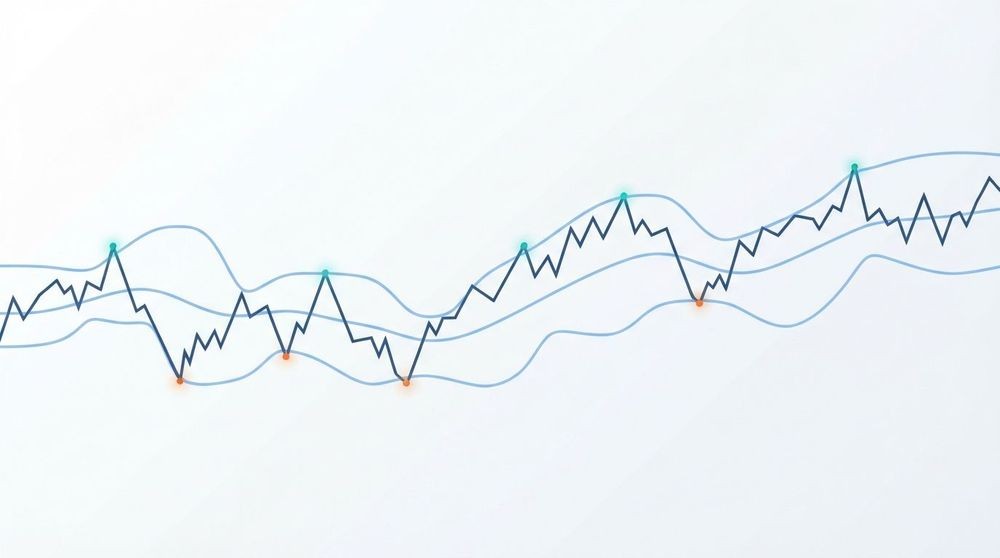
Bollinger Bands give stock traders a real-time answer to one of the most useful questions in technical analysis: is this price relatively high or low right now? Created by John Bollinger, the indicator wraps a 20-period simple moving average (SMA) with upper and lower bands set two standard deviations away, and the system was designed to contain roughly 88–89% of all price action. That statistical framing is what makes Bollinger Bands stocks analysis so practical: a price near the upper band is statistically high relative to recent history, and a price near the lower band is statistically low.
Quick-start rules you can apply today:
- Default settings: 20-period SMA, 2 standard deviations. These work well on daily charts for most U.S. equities.
- Band touch: A price touching the upper or lower band is information, not an automatic signal. Context determines whether it’s a reversal or a continuation.
- Squeeze setup: When the bands narrow significantly, a volatility expansion is likely coming. Wait for a confirmed breakout before entering.
- One practical rule: Never trade a band touch alone. Pair it with at least one confirmation indicator (RSI, volume, MACD) before committing capital.
Bollinger Bands are a volatility gauge first. They tell you where price is relative to recent behavior, but they do not tell you which direction it will move next. That distinction keeps traders out of a lot of bad trades.
Key Takeaways
Bollinger Bands are one of the most practical volatility tools available for stock traders, but their power comes from how you combine them with context and confirmation.
| Point | Details |
|---|---|
| Default settings | Use a 20-period SMA with 2 standard deviations; these contain roughly 88–89% of price action on daily charts. |
| Three core setups | Mean-reversion bounce, squeeze-breakout, and trend-following (riding the band) cover most practical use cases. |
| Confirmation is mandatory | Always pair a band signal with RSI, volume, or MACD; a band touch alone is information, not a trade trigger. |
| Adjust for conditions | Shorten the period and reduce standard deviations for intraday charts; lengthen both for swing or position trades. |
| Handy Markets | Set real-time alerts for band touches, squeezes, and breakouts via Telegram, Slack, SMS, or webhook on Handy Markets. |
Table of Contents
- What are Bollinger Bands and how are they calculated for stocks?
- How do you read Bollinger Bands on a stock chart?
- What are the most practical Bollinger Band trading methods for stocks?
- How do professional traders confirm Bollinger Band signals?
- How do you find and alert Bollinger Band setups for U.S. stocks?
- When do Bollinger Bands fail, and what mistakes should you avoid?
- A quick checklist before you trade any Bollinger Band setup
- How Handy Markets thinks about Bollinger Bands in a trading workflow
- Real-time Bollinger Band alerts, built into your workflow
- Sources
What are Bollinger Bands and how are they calculated for stocks?
The formula behind Bollinger Bands is straightforward once you see it broken down. The middle band is simply a moving average. The outer bands measure how far price has strayed from that average, expressed in standard deviations.
Formula:
- Middle band = SMA(n)
- Upper band = SMA(n) + (SD × multiplier)
- Lower band = SMA(n) − (SD × multiplier)
Where n is the lookback period, SD is the standard deviation of closing prices over that same period, and the multiplier is typically 2.
Default settings at a glance
| Parameter | Default Value | Why It’s Used |
|---|---|---|
| Period (n) | 20 | Approximates one trading month; balances responsiveness and noise |
| Standard deviations | 2 | Contains ~88–89% of price action statistically |
| Band type | Simple MA | Consistent with Bollinger’s original design |
Standard deviation is the key ingredient. When prices are moving erratically, standard deviation rises and the bands widen. When price action quiets down, standard deviation shrinks and the bands contract. This is why the bands breathe with the market rather than sitting at a fixed distance from price.
How do you read Bollinger Bands on a stock chart?
Learning to read the shape of the bands matters as much as watching where price sits within them. The bands tell a story about the market’s current mood, and that story changes constantly.
The Bollinger Squeeze
When the upper and lower bands move unusually close together, that’s a squeeze. It signals that volatility has compressed, and historically, low-volatility periods tend to precede high-volatility ones. The squeeze itself doesn’t tell you which direction the breakout will go, but it raises the probability that a significant move is coming. Traders watch for the bands to start widening again as the first sign that the market is picking a direction.

Band expansion and breakouts
Once the bands start widening after a squeeze, price often moves decisively. Breakouts that occur after a squeeze tend to be more meaningful than breakouts from already-wide bands, because the compressed volatility has been building pressure. A breakout from wide bands may simply be continuation of an existing trend rather than a new directional move.
Touches, outside moves, and “walking the band”
A price touching the upper band is not a sell signal. In a strong uptrend, price can tag the upper band repeatedly and even run along it for days or weeks. ChartSchool describes this as “walking the band,” and it’s one of the most misunderstood behaviors in Bollinger Bands analysis. Traders who automatically sell every upper-band touch in a trending stock will exit good positions far too early.
Fidelity’s technical analysis guide notes that prices can remain outside the bands during strong trends, which is exactly why trend context matters before acting on any band touch.
The middle band as a pivot
The 20-SMA middle band often acts as support in uptrends and resistance in downtrends. In range-bound markets, many traders use a bounce to the middle band as a reasonable profit target after entering near the lower band. It’s a clean, rules-based exit that doesn’t require predicting where price will go next.
Pro Tip: Before acting on any band touch, ask yourself: is this stock in a trend or a range? The answer changes the setup entirely. A lower-band touch in a downtrend is a continuation signal, not a buy.
Interactive Brokers’ trading education reinforces this: Bollinger Bands are primarily a volatility gauge, and pairing them with volume or momentum indicators is what separates useful signals from noise.
What are the most practical Bollinger Band trading methods for stocks?
Three setups account for most of how traders actually use Bollinger Bands in U.S. equity markets. Each has clear entry, stop, and target rules.
Setup 1: Mean-reversion bounce in a range
This works best when a stock has been trading sideways and the bands are relatively flat.
- Confirm the stock is range-bound (flat middle band, no strong trend).
- Wait for price to touch or close near the lower band.
- Look for a confirmation signal: an RSI reading below 35 turning up, a bullish candlestick reversal, or a volume spike.
- Enter long on the next bar’s open after confirmation.
- Place your stop just below the lower band (roughly 0.5–1 ATR below the entry).
- Target the middle band (20-SMA) as the first exit, the upper band as the full exit.
Position size should reflect the distance from entry to stop. If the band width is unusually wide, reduce size accordingly.
Setup 2: Squeeze-breakout entry
- Identify a squeeze: bands are at their narrowest in the past 20–30 sessions (bandwidth percentile below the 20th percentile works well as a filter).
- Watch for price to close outside either band on expanding volume.
- Use %B above 1.0 (for an upside breakout) or below 0.0 (for a downside break) as confirmation.
- Enter on the close of the breakout bar or the open of the next bar.
- Place your stop inside the squeeze range, near the opposite band at the time of entry.
- Target a move equal to the band width at the time of the squeeze, or use 1.5–2× ATR as a guide.
Pro Tip: Volume is your best friend on a squeeze breakout. A breakout on below-average volume has a much higher failure rate. Wait for volume to confirm before committing full size.
Setup 3: Trend-following (riding the band)
In a confirmed uptrend, price often pulls back to the middle band before resuming higher.
- Confirm the uptrend: price above the 20-SMA, 20-SMA sloping up.
- Wait for a pullback to the middle band.
- Enter when price closes back above the middle band after touching it.
- Stop goes below the most recent swing low or 1 ATR below the middle band.
- Hold as long as price continues to tag or run along the upper band.
- Exit when price closes back below the middle band on a daily chart.
Scaling out partially at the upper band and letting the rest ride keeps you in strong trends without giving back all your gains on a single reversal.
Investopedia’s Bollinger Bands guide covers these setups in depth, including M-top and W-bottom pattern confirmations that add another layer of precision to mean-reversion entries.
How do professional traders confirm Bollinger Band signals?
No serious trader uses Bollinger Bands in isolation. The bands answer the “where is price?” question; confirmation indicators answer the “why might it move?” question. Combining both is what separates high-probability setups from coin flips.
Common confirmation filters professionals use:
- RSI or Williams %R: An RSI below 30 at a lower-band touch strengthens a mean-reversion case. RSI above 70 at an upper-band touch in a range adds weight to a reversal thesis.
- MACD: A MACD crossover in the direction of the trade, occurring near a band touch, adds momentum confirmation. Divergence between MACD and price at a band extreme is a particularly strong signal.
- Volume: Above-average volume on a breakout bar validates the move. Low volume on a band touch in a range often precedes a failed reversal.
- %B: This indicator plots where price sits within the bands on a 0–1 scale. A %B reading above 1.0 means price is above the upper band; below 0.0 means it’s below the lower band. Crossing back through 0.5 (the middle band) can act as a trend filter.
- Keltner Channels: Overlaying Keltner Channels on the same chart is a classic squeeze-detection method. When Bollinger Bands contract inside the Keltner Channel, a squeeze is confirmed with higher reliability.
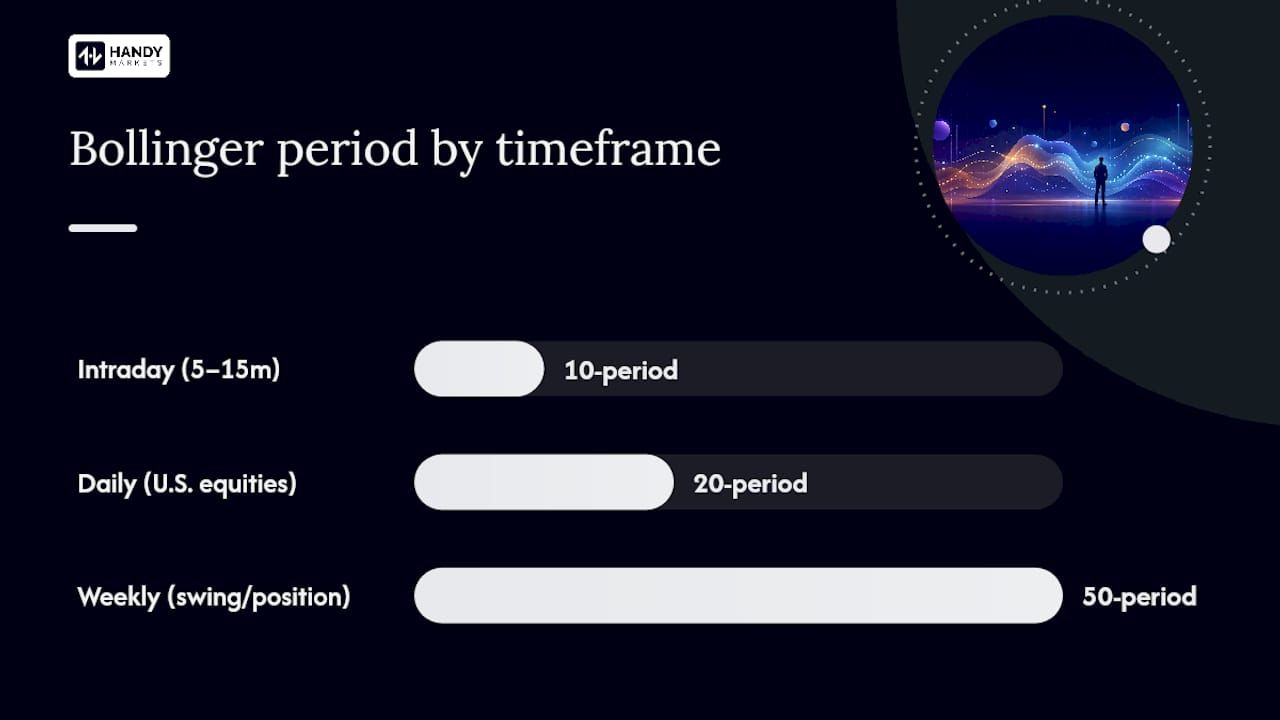
For timeframe guidance: on intraday charts (5–15 minutes), consider shortening the period to 10 and reducing the standard deviation to 1.5 to keep the bands responsive. On weekly charts for swing or position trades, lengthening the period to 50 and widening to 2.5 standard deviations reduces noise. Daily charts with the default 20/2 setting remain the most widely used for U.S. equities.
Combining stock market indicators thoughtfully reduces false signals without adding so much lag that you miss the move entirely. The goal is two non-correlated filters pointing in the same direction before you enter.
How do you find and alert Bollinger Band setups for U.S. stocks?
Knowing the setups is one thing. Finding them systematically across hundreds of stocks is where screeners and alerts become indispensable.
Screener criteria for common setups:
- Squeeze scan: Bandwidth percentile below the 20th percentile over a 52-week lookback; average daily volume above 500,000 shares.
- Lower-band touch: Daily close at or below the lower Bollinger Band; RSI(14) below 40; relative volume above 1.2×.
- Upper-band breakout: Daily close above the upper band; volume above 1.5× the 20-day average; %B above 1.0.
- Middle-band reclaim (trend-follow entry): Price closes above the 20-SMA after touching it from above; 20-SMA slope positive over the past 5 sessions.
StockCharts provides live chart examples showing exactly how these band touches and squeezes appear on real U.S. equity charts, which is useful when you’re calibrating your own screener criteria.
Sample alert rules:
- “Daily close crosses above upper Bollinger Band with volume greater than 1.5× 20-day average.”
- “Daily close touches lower Bollinger Band and RSI(14) is below 35.”
- “Bandwidth drops to a 52-week low” (squeeze alert).
equities); and use a walk-forward approach where you test on one period and validate on a separate out-of-sample period. A solid backtesting methodology prevents you from curve-fitting a setup that only worked in one specific market environment.
Handy Markets lets you set alerts for band touches, breakouts, and squeeze conditions across U.S. stocks, with delivery via Telegram, Slack, webhook, email, or SMS, so you never miss a setup while away from your screen.
When do Bollinger Bands fail, and what mistakes should you avoid?
Bollinger Bands are reliable tools used incorrectly by a surprising number of traders. Knowing the failure modes is as valuable as knowing the setups.
Common mistakes and their mitigations:
- Treating every band touch as a signal. A touch is information, not a trigger. Always require at least one confirmation before acting. Mitigation: add RSI or volume as a mandatory filter.
- Using default settings blindly on every timeframe. A 20/2 setting on a 1-minute chart produces far more noise than signal. Mitigation: adjust period and standard deviation to match your timeframe and the stock’s typical volatility.
- Ignoring trend context. A lower-band touch in a downtrending stock is a continuation signal, not a reversal. Mitigation: check the slope of the 20-SMA and the broader market context before entering counter-trend.
- Overtrading during news-driven volatility. Earnings releases, Fed announcements, and macro events cause bands to widen explosively. Signals generated during these periods have a much higher false-breakout rate. Mitigation: reduce position size by 50% or avoid new entries entirely in the 30 minutes before and after major announcements.
- Ignoring volume. A band breakout on low volume is one of the most reliable false-signal patterns in Bollinger Bands trading. Mitigation: require volume above the 20-day average on any breakout entry.
The Investopedia technical analysis article on Bollinger Bands covers the lag issue directly: because the bands are based on a moving average, they react to price rather than predict it. During fast-moving markets, the bands can widen after the move has already happened. A market volatility checklist helps you calibrate your expectations when conditions shift quickly.
Solid risk management is the backstop for all of this. No setup, however well-confirmed, eliminates the need for a defined stop and a position size you can hold without panic.
A quick checklist before you trade any Bollinger Band setup
Run through these steps before entering any position based on Bollinger Bands analysis:
- Set your chart correctly: 20-period SMA, 2 standard deviations, daily timeframe as your baseline. Adjust only if you have a specific reason.
- Check the trend: Is the 20-SMA sloping up, down, or flat? This determines whether you’re trading a bounce, a breakout, or a continuation.
- Check band width: Are the bands wide (high volatility, avoid new breakout entries) or narrow (squeeze, watch for expansion)?
- Confirm with one secondary indicator: RSI, MACD, or volume. One non-correlated filter is enough; adding three creates analysis paralysis.
- Define entry, stop, and target before you enter: Entry at the signal bar’s close or next open; stop below the lower band or the swing low; target at the middle band or upper band depending on setup.
- Size to volatility: Use band width or ATR to set your position size. Wider bands mean wider stops, which means smaller size for the same dollar risk.
- Set an alert: Once you’ve identified a setup, set an alert so you don’t have to watch the screen constantly.
How Handy Markets thinks about Bollinger Bands in a trading workflow
We’ve watched traders get the most out of Bollinger Bands not by finding a perfect setting, but by building a consistent process around them. The bands are a starting point for a conversation with the chart, not a conclusion. What works reliably is pairing a band signal with one clear confirmation, defining the stop before entry, and using alerts to stay informed without being glued to a screen.
The most underrated part of this workflow is the alert layer. A squeeze can resolve overnight. A band touch on a stock you’re watching can happen while you’re in a meeting. Multi-channel alerts, delivered to Telegram or Slack the moment a condition is met, turn a passive watchlist into an active early-warning system. That’s where Handy Markets fits naturally into a Bollinger Bands workflow: not as a replacement for your analysis, but as the infrastructure that makes sure your analysis actually reaches you in time to act.
Real-time Bollinger Band alerts, built into your workflow
Handy Markets delivers real-time price data and customizable alerts for U.S. stocks, so your Bollinger Band setups work for you around the clock.
Set an alert the moment a stock closes above its upper band on high volume, or when bandwidth drops to a 52-week low signaling a squeeze. Alerts reach you via Telegram, Slack, Discord, SMS, webhook, or email, whichever channel fits your routine. No more refreshing charts manually or missing a breakout because you stepped away.
Getting started takes four steps:
- Build your watchlist on the Handy Markets platform.
- Define your screener criteria (band touch, squeeze, %B threshold, volume filter).
- Create your alert with your preferred delivery channel.
- Validate the setup against recent price history before going live.
The educational content here explains the methods. Handy Markets helps you implement them, reliably and in real time.
Sources
- bollinger-bands
- Bollinger Bands | Trading Lesson | Traders’ Academy
- Bollinger Bands
- John Bollinger’s Official Bollinger Band Website
- What Are Bollinger Bands? - Fidelity
This article is general information, not a substitute for advice from a qualified financial advisor. Consult a qualified financial professional about your own circumstances before acting on anything here.