TL;DR:
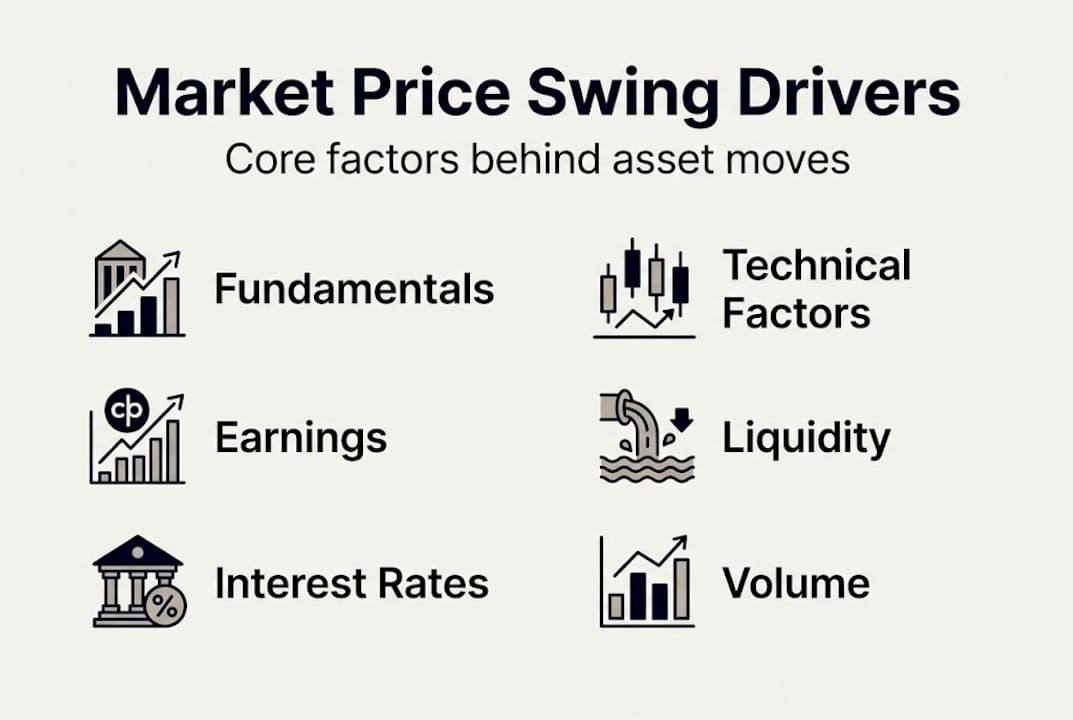
- Market price swings are driven by fundamentals, technical factors, investor sentiment, and external shocks.
- Liquidity, trading volume, and market makers influence short-term volatility and price accuracy.
- Recognizing the interaction of these forces helps traders anticipate and respond confidently to market moves.
Price swings can feel like the market is acting on pure emotion, but there’s almost always a reason behind every move. Supply and demand imbalances shaped by fundamentals, technical conditions, and investor psychology drive the vast majority of price action across stocks, crypto, commodities, and forex. Once you understand the real forces at work, volatility stops feeling like a threat and starts looking like a map. This article breaks down the four key drivers of price swings, giving you a practical framework to read the market with more confidence and act with greater precision.
Table of Contents
- Fundamental factors: Earnings, economic growth, inflation and interest rates
- Technical factors: Liquidity, trading volume and market makers
- Market sentiment and investor psychology
- External shocks: Geopolitical risks and sector-specific volatility
- Why most traders miss the real catalysts behind price swings
- Take control of price swings with real-time alerts
- Frequently asked questions
Key Takeaways
| Point | Details |
|---|---|
| Fundamentals drive trends | Economic reports, earnings, and central bank decisions often set the direction for asset prices. |
| Technical factors cause spikes | Liquidity and trading volume shape sharp, short-term swings that traders must watch closely. |
| Sentiment shapes volatility | Investor mood swings and news headlines can move prices far from underlying value, especially in crypto. |
| External shocks create risk | Unexpected events like wars and terror threats introduce sudden, sector-specific volatility. |
| Integrated analysis is key | Combining fundamentals, technicals, and sentiment leads to smarter trading decisions and better risk management. |
Fundamental factors: Earnings, economic growth, inflation and interest rates
Now that you know swings are driven by more than randomness, let’s unpack the most influential foundational forces. Fundamentals are the bedrock of any price move. When a company reports earnings that beat expectations, its stock often jumps. When inflation data comes in hotter than forecast, bond yields rise and equities can sell off sharply. These aren’t coincidences. Price swings are rooted in supply and demand imbalances that fundamentals directly influence.
One of the most important insights from recent research is that stock price fluctuations are predominantly driven by changes in expected cash flows rather than shifts in expected returns. In plain terms, when investors revise how much money they think a company will generate in the future, the stock price moves to reflect that new expectation. This is why earnings season creates such intense volatility across equity markets.
Interest rates amplify this effect. When central banks raise rates, the present value of future cash flows drops, which pushes asset prices lower. The reverse happens when rates fall. Understanding this relationship is foundational for anyone trading across forex volatility drivers or equity markets.
Pro Tip: Markets often price in expectations before the data is released. Position yourself ahead of major economic releases by tracking consensus forecasts and watching how assets behave in the days leading up to the announcement.
Here are the key fundamental indicators every trader should monitor:
- GDP growth rate: Signals overall economic health and risk appetite
- CPI (Consumer Price Index): Measures inflation, directly influencing central bank decisions
- Earnings per share (EPS): Drives individual stock valuations and sector rotation
- Interest rate decisions: Affect borrowing costs, currency strength, and equity valuations
- Unemployment data: Reflects economic momentum and consumer spending power
| Fundamental event | Stocks | Bonds | Forex | Commodities |
|---|---|---|---|---|
| Strong earnings beat | Bullish | Neutral | Neutral | Neutral |
| Rate hike surprise | Bearish | Bearish | Bullish (USD) | Bearish |
| High inflation print | Mixed | Bearish | Volatile | Bullish |
| GDP miss | Bearish | Bullish | Bearish | Bearish |
For a broader look at how these forces connect, our market volatility guide is a solid starting point. If you’re newer to the topic, mastering investing volatility walks through the core concepts step by step.
Technical factors: Liquidity, trading volume and market makers
While fundamentals shape long-term moves, technical factors drive much of the daily price action. Liquidity is the single most underestimated force in short-term trading. When a market is liquid, large orders get absorbed without much price impact. When liquidity is thin, even a modest trade can send prices lurching in one direction.
Market makers play a central role here. They continuously quote buy and sell prices, keeping markets functional. But during periods of stress, market makers pull back, spreads widen, and prices can gap dramatically. Incidental transactions like index rebalances or large hedge fund flows create short-term swings that have nothing to do with a company’s intrinsic value. This is why you’ll sometimes see a perfectly healthy stock drop sharply for no apparent fundamental reason.
Trading volume is your best real-time signal. High volume on a price move confirms conviction. Low volume moves are more likely to reverse. Watching volume alongside price helps you separate genuine breakouts from noise.
| Asset class | Typical liquidity | Intraday volatility |
|---|---|---|
| Large-cap stocks (e.g., Apple) | Very high | Low to moderate |
| Small-cap stocks | Moderate | High |
| Major forex pairs (EUR/USD) | Extremely high | Low |
| Bitcoin | Moderate to high | Very high |
| Emerging market currencies | Low | Very high |
Pro Tip: Watch for unusual volume spikes around quarterly index rebalances. Large passive funds must buy and sell specific stocks to match their benchmark, creating predictable short-term price distortions you can anticipate.
Here’s a practical process for analyzing liquidity before entering a trade:
- Check the bid-ask spread. A wide spread signals low liquidity and higher transaction costs.
- Review average daily volume over the past 20 days. Compare it to current volume.
- Look at the order book depth if available. Thin order books mean bigger potential price swings.
- Identify upcoming index rebalance dates or major fund flow events in your watchlist.
- Avoid entering large positions in low-liquidity windows like pre-market or late Friday afternoons.
For real-time context, live market price strategies can help you apply these steps effectively. Pairing liquidity analysis with market trend strategies gives you a more complete picture of what’s actually moving prices.
Market sentiment and investor psychology
Beyond numbers and chart patterns, the collective mindset of traders shapes prices in surprising ways. Sentiment is the invisible engine behind some of the most dramatic price swings in financial history. It’s what turns a modest news event into a full-blown market panic, or a speculative rumor into a parabolic rally.
Market sentiment, driven by investor psychology and news flow, is a primary force behind price volatility. This is especially visible in crypto markets, where speculative participation often outweighs fundamental analysis. Traditional finance anchors valuations in cash flows, but Bitcoin doesn’t generate earnings. Its price is almost entirely a function of collective belief and sentiment.
“Market sentiment is the invisible hand guiding asset price swings far more often than most realize.”
Consider how Bitcoin reacts to news. A single tweet from a prominent figure, a regulatory announcement, or even a rumor about institutional adoption can trigger 10% to 20% moves within hours. Compare that to a blue-chip stock, which might move 3% to 5% on a strong earnings beat. The difference isn’t just volatility. It’s the degree to which sentiment, rather than fundamentals, controls the price.
Common sentiment drivers to watch:
- FOMO (fear of missing out): Pushes prices above fair value during rallies
- Fear and panic selling: Drives prices below intrinsic value during corrections
- Hype cycles: Amplify moves in speculative assets like crypto and meme stocks
- Mainstream media coverage: Brings in retail traders who amplify existing trends
- Social media and forums: Create coordinated buying or selling pressure
Learning to read sentiment alongside price data is a genuine edge. Our market fluctuation guide explains how to decode these mood shifts, and pairing that with stock market indicators gives you a more structured approach to tracking collective psychology.
External shocks: Geopolitical risks and sector-specific volatility
Adding another layer, external shocks can disrupt even the most stable trends, making volatility management essential. Wars, elections, regulatory crackdowns, and natural disasters don’t follow a schedule. They arrive without warning and can instantly reprice entire sectors.
Research confirms that geopolitical risks cause distinct, sector-specific volatility in US stocks. Defense and energy companies often rally during conflict escalation, while technology and consumer discretionary stocks tend to fall. The research also highlights a counterintuitive finding: terror threats generate more market volatility than actual terror acts, and war escalations move markets more than initial threats. The uncertainty of what might happen is often more destabilizing than the event itself.
This means that as a trader, you need to be watching the news cycle, not just the price chart. A rising geopolitical tension can create sector rotation opportunities well before any shots are fired.
Common types of external shocks that move markets:
- Military conflicts and war escalations: Spike energy prices, boost defense stocks, weaken risk assets
- Regulatory changes: Crypto crackdowns, antitrust actions, or new financial rules can reprice entire sectors overnight
- Natural disasters: Disrupt commodity supply chains and regional economies
- Political elections and policy shifts: Create uncertainty around tax policy, trade tariffs, and government spending
- Pandemic or health crises: Trigger broad market selloffs and sector-specific rotations
The practical takeaway is straightforward. Diversify across sectors and asset classes so no single shock wipes out your portfolio. Stay alert around major global news days using our volatility strategies checklist, and use market fluctuation analysis tools to assess how different assets respond to specific shock types.
Why most traders miss the real catalysts behind price swings
Bringing together the layers, let’s consider how these forces interact and why most traders get it wrong. The most common mistake we see is over-reliance on a single framework. Technical traders sometimes dismiss fundamentals entirely. Macro investors ignore how sentiment can keep a mispriced asset moving in the wrong direction for months. Neither approach alone is sufficient.
The real catalysts behind major price swings are almost always a combination of forces. A geopolitical shock might trigger the move, but underlying liquidity conditions determine how far it goes. Sentiment then takes over, pushing prices beyond what the fundamentals justify. By the time most traders recognize the full picture, the opportunity has passed.
We believe the most effective approach is to review past major swings with full context. Go back to a significant move in your preferred asset and ask: what was the fundamental backdrop, what did liquidity look like, and what was the prevailing sentiment? You’ll almost always find multiple forces converging. That pattern recognition is what separates reactive trading from genuine market understanding.
Pro Tip: After any major price swing, do a post-mortem. Use our market fluctuation understanding resource to identify which driver was primary. Over time, you’ll build an intuition for how these forces interact in your specific markets.
Take control of price swings with real-time alerts
Understanding what drives price swings is only half the equation. Acting on that knowledge in real time is where it becomes profitable. At Handy.Markets, we built our platform specifically to help traders like you stay ahead of every move.
You can set free price alerts across stocks, crypto, forex, and commodities, delivered instantly via Telegram, Discord, Slack, SMS, or email. Whether you’re monitoring a Crypto 4 price chart for a breakout or tracking macro-driven moves across multiple asset classes, our tools keep you informed without the noise. Visit Handy.Markets to start monitoring the markets that matter most to you, all in one place.
FAQ
Are price swings always predictable or linked to specific events?
Most price swings are tied to identifiable drivers, but sudden external shocks can cause unexpected volatility. Geopolitical risks like terror threats and war escalations are known to cause sector-specific swings that arrive without warning.
Why do some assets swing more wildly than others?
Assets with lower liquidity or higher speculative participation experience bigger swings. Crypto markets are driven more by sentiment and speculation than by fundamentals, which amplifies volatility compared to stable, high-liquidity assets.
How can traders mitigate the risks caused by price swings?
Traders can use alerts, diversify across asset classes, and monitor key indicators closely. Staying informed about fundamental and technical drivers reduces the chance of being caught off guard by sudden moves.
Does market sentiment actually affect asset prices?
Yes, investor psychology and news are major contributors to volatility across all markets. Sentiment can push prices well above or below fair value, especially in speculative or thinly traded assets.