TL;DR:
- Technical analysis forecasts future asset prices by examining past market data like price and volume. It relies on the idea that price patterns repeat because human psychology influences trading decisions consistently.
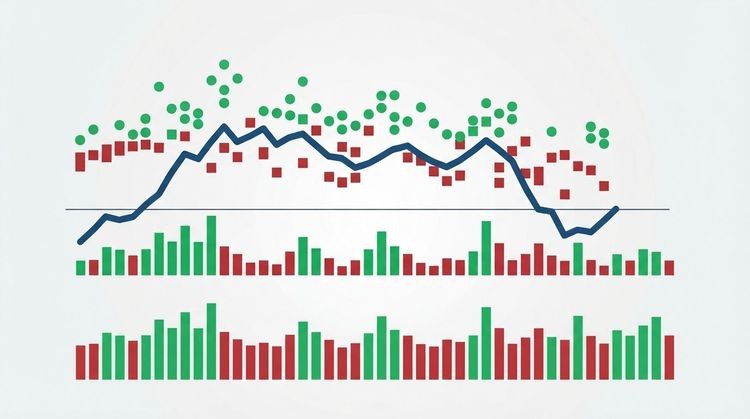
Technical analysis is defined as a methodology for forecasting the direction of financial asset prices by studying past market data, primarily price and volume. Unlike fundamental analysis, which examines earnings reports and economic drivers, technical analysis focuses entirely on what the chart tells you. The core premise is simple: price reflects everything the market knows at any given moment. Because human psychology drives buying and selling decisions, price patterns tend to repeat over time. Whether you trade stocks, forex, or commodities, understanding what is technical analysis gives you a structured way to read market behavior and make more confident decisions.
What is technical analysis and how does it work?
Technical analysis works by treating price as the primary signal. The idea, often summarized as “the market discounts everything,” holds that all known information is already embedded in the current price. Analysts do not need to read earnings calls or economic forecasts. They read the chart.
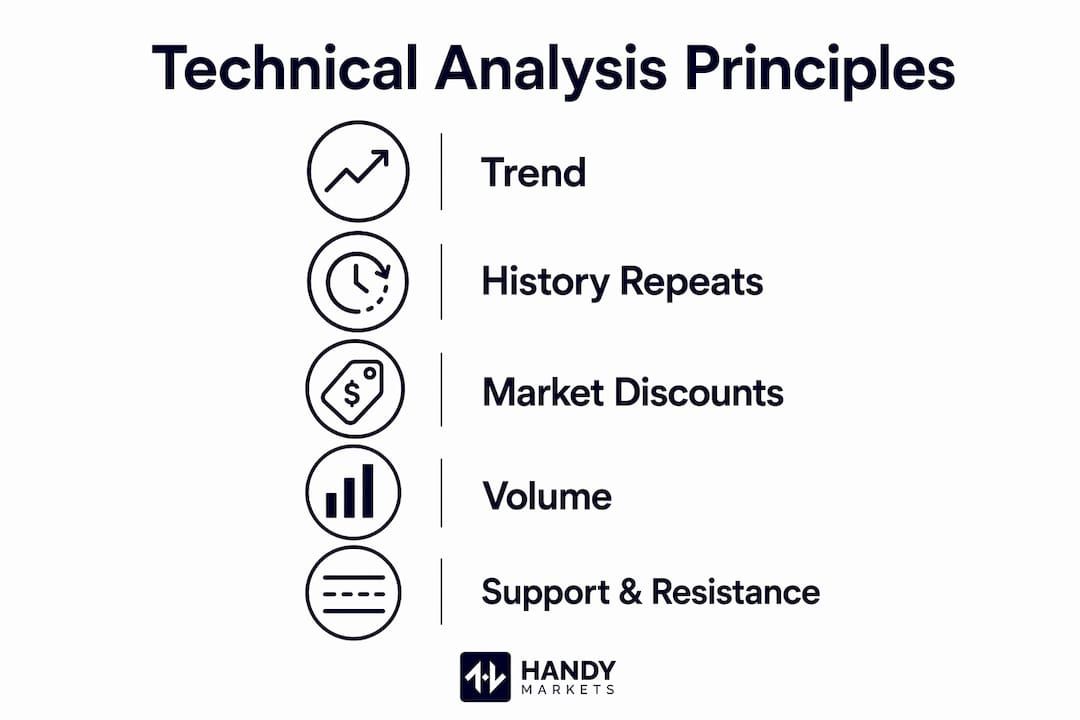
The foundation of this approach rests on three core principles. First, price moves in trends. Second, history tends to repeat itself because investor psychology does not change much over time. Third, volume confirms price. A price move on high volume carries more weight than the same move on thin volume.
These principles apply across asset classes. Technical analysis works on stocks, forex pairs, commodities like gold and crude oil, and cryptocurrencies. The only requirement is a sufficient history of price and volume data. That universality is one reason the method has remained popular for over a century.
How do technical analysts study markets and what tools do they use?
Technical analysts start with a price chart, then layer on indicators to refine their read of the market. Three chart types dominate: line charts, bar charts, and candlestick charts. Candlestick charts are the most widely used because each candle shows the open, high, low, and close for a given period, revealing sentiment at a glance.
From there, analysts apply two categories of technical indicators:
- Overlays sit directly on the price chart. Examples include moving averages and Bollinger Bands, which show trend direction and volatility range.
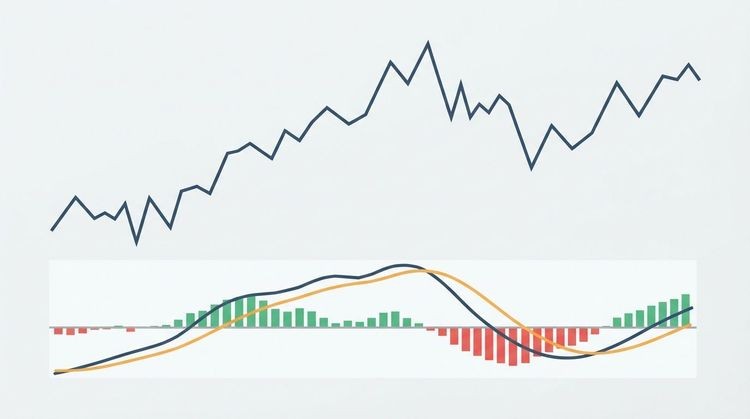
- Oscillators appear below the chart and measure momentum or overbought/oversold conditions. The Relative Strength Index (RSI) and Moving Average Convergence Divergence (MACD) are the most common.
RSI measures momentum by comparing the size of recent gains against recent losses on a scale of 0 to 100. A reading above 70 signals the asset may be overbought. A reading below 30 suggests it may be oversold. That single indicator can alert you to a potential reversal before price confirms it.
Support and resistance levels are equally central. Support is a price zone where buying interest tends to absorb selling pressure. Resistance is where sellers typically push back against rising prices. These levels help traders plan entries, exits, and stop-loss placements with clear logic rather than guesswork.
Volume adds another layer of confirmation. When price breaks above a resistance level on strong volume, that breakout carries conviction. When it breaks on weak volume, traders treat it with skepticism.
Pro Tip: Before adding any indicator, learn to read raw price structure first. Trendlines, support zones, and candlestick patterns on a clean chart often tell you more than a screen full of oscillators.
| Indicator | Type | Primary use |
|---|---|---|
| Moving average | Overlay | Identifies trend direction and dynamic support |
| Bollinger Bands | Overlay | Measures price volatility and potential breakouts |
| RSI | Oscillator | Spots overbought or oversold momentum conditions |
| MACD | Oscillator | Tracks trend momentum and potential crossover signals |
| Volume | Standalone | Confirms the strength of price moves and breakouts |
You can explore a curated list of essential market indicators to see how these tools work together in practice.
What are the advantages and limitations of technical analysis?
Technical analysis offers real, practical benefits. It helps traders time entries and exits more precisely, manage risk through defined stop-loss levels, and apply a consistent decision framework across different markets. Because it works wherever price and volume data exist, it applies across stocks, forex, and commodities without needing to rebuild your entire approach for each asset class.
The importance of technical analysis also shows up in risk management. When you know where support sits, you know where to place your stop. That clarity reduces emotional decision-making and keeps losses contained.

The limitations are equally real, and ignoring them is costly. The efficient market hypothesis argues that prices already reflect all available information, making consistent prediction impossible. Research on technical analysis effectiveness is mixed. Some studies show edge in specific markets and timeframes. Others show no statistically significant advantage.
- Indicators lag. Most technical indicators are derived from past price data, so they confirm moves that have already started rather than predicting them in advance.
- False signals are common. A moving average crossover or RSI reading can trigger a trade that immediately reverses.
- Noise confusion is a persistent problem. Short-term price fluctuations can look like meaningful signals when they are not.
- Regime changes break patterns. A strategy that worked in a trending market often fails in a choppy, sideways market.
- Confirmation bias is a real risk. Traders who want to buy often find bullish signals and ignore bearish ones on the same chart.
“No technical indicator is 100% foolproof. Signals should not be relied on singularly but corroborated through multiple indicators and analysis techniques.”
Pro Tip: Treat technical analysis as a decision-support framework, not a prediction engine. The goal is to improve the probability of a good outcome, not to eliminate uncertainty.
How can investors apply technical analysis effectively in their trading strategies?
Effective application of technical analysis starts with a written trading plan. Vague intentions like “buy when it looks strong” produce inconsistent results. Rule-based trading systems predefine setup conditions, entry triggers, exit targets, and stop-loss levels before a trade is placed. That structure removes emotion from the equation and makes results measurable.
Here is a practical framework for applying technical analysis:
- Define your setup. Identify the conditions that must be present before you consider a trade. For example, price above the 50-day moving average, RSI below 60, and a pullback to a known support zone.
- Set your entry trigger. Wait for a specific signal, such as a bullish candlestick pattern at support, before entering.
- Place your stop-loss. Put it below the support level you identified. If price breaks that level, your thesis is wrong.
- Set a profit target. Use the next resistance level or a fixed risk-to-reward ratio, such as 2:1, as your target.
- Review your trades. Log every trade with the setup, outcome, and what you observed. Patterns in your own results are as valuable as patterns on a chart.
Time horizon matters too. Technical analysis applies across different time horizons, from intraday charts for day traders to weekly charts for position traders. A signal on a daily chart carries more weight than the same signal on a 5-minute chart. Aligning your time horizon with your strategy prevents misreading short-term noise as a trend change.
Misinterpreting short-term noise as a genuine trend reversal is one of the most common and expensive mistakes beginners make. Requiring confirmation across multiple indicators and at least two timeframes reduces this error significantly.
Pro Tip: Start with one or two indicators you understand deeply rather than ten you understand vaguely. Mastery of RSI and a moving average beats a cluttered chart with a dozen conflicting signals.
For a deeper look at reading price behavior, the guide on interpreting price changes walks through chart-based analysis with practical examples.
What are the key technical analysis strategies and how do they differ?
Technical analysis strategies fall into a few distinct categories, each suited to different market conditions and trader personalities.
Trend following is the most widely practiced approach. The idea is to identify the direction of the prevailing trend and trade in that direction. Moving averages are the primary tool. When the 50-day moving average crosses above the 200-day moving average, that “golden cross” signals a potential uptrend. Trend following works best in markets with clear directional momentum.
Mean reversion takes the opposite view. It assumes that prices stretched far from their average will eventually return to it. Bollinger Bands and RSI are the core tools here. When price touches the lower Bollinger Band and RSI is below 30, a mean reversion trader looks for a bounce back toward the middle band.
Breakout trading focuses on price moving decisively beyond a defined support or resistance level. The logic is that a break of a key level signals the start of a new move. Volume confirmation is critical. A breakout without volume often fails.
Reversal trading attempts to catch the end of a trend and the beginning of a new one. Chart patterns like head and shoulders, double tops, and double bottoms are the primary signals. This approach carries higher risk because you are trading against the existing trend.
| Strategy | Best market condition | Core tools |
|---|---|---|
| Trend following | Trending, directional markets | Moving averages, MACD |
| Mean reversion | Range-bound, sideways markets | Bollinger Bands, RSI |
| Breakout trading | Consolidation before a move | Volume, support/resistance levels |
| Reversal trading | Late-stage trends | Head and shoulders, double tops |
Many professional traders combine elements of these approaches. A trend follower might use mean reversion signals to time better entries within the trend. That layering of methods, combined with strict risk rules, is what separates disciplined technical analysis from guesswork.
For broader context on how these strategies fit within market fluctuation analysis, the methods and tools covered there complement what you apply here.
Key Takeaways
Technical analysis is a structured, rules-based method for reading market behavior through price and volume, and its effectiveness depends entirely on disciplined application and multi-indicator confirmation.
| Point | Details |
|---|---|
| Core definition | Technical analysis studies past price and volume data to forecast future price movements. |
| Essential tools | Candlestick charts, moving averages, RSI, MACD, and support/resistance levels form the foundation. |
| Honest limitations | Indicators lag price and produce false signals; no single tool is reliable on its own. |
| Rule-based trading | Predefining entries, exits, and stop-losses removes emotion and makes results measurable. |
| Strategy selection | Choose trend following, mean reversion, breakout, or reversal based on current market conditions. |
Technical analysis is useful, but most traders use it wrong
At Handy Markets, we watch a lot of traders approach technical analysis the same way. They load up a chart with six indicators, wait for all of them to agree, and then wonder why they miss every move. The problem is not the tools. The problem is the expectation.
Technical analysis is a language for reading market behavior, not a formula for predicting it. The traders who use it well are not the ones with the most indicators. They are the ones who understand price structure deeply, know where the important levels are, and have a clear rule for when they are wrong.
The biggest misconception we see is that technical indicators lag the market by design. They are built from past price data. That means they confirm what has already happened. Traders who treat RSI or MACD as predictive tools are reading yesterday’s newspaper and calling it a forecast.
What actually works is combining price structure awareness with one or two confirming indicators and a non-negotiable stop-loss. That combination does not eliminate losing trades. Nothing does. It gives you a framework where your wins can be larger than your losses over time, and that is the only edge that matters.
Technical analysis also does not replace fundamental analysis. The best investors we observe use both. Fundamentals tell you what to buy. Technicals tell you when to buy it.
Put your technical analysis into practice with live market data
Reading about technical analysis builds knowledge. Applying it to live markets builds skill. Handy Markets gives you real-time prices across stocks, forex, crypto, and commodities in one place, so you can watch how price behaves around support and resistance levels as it happens.
You can also set custom price alerts for key levels across Telegram, Discord, Slack, SMS, and email. When price approaches a zone you have identified, you get notified instantly. That means you spend less time watching screens and more time acting on setups you have already planned. Handy Markets also covers live stock quotes and charts with the data depth you need to apply the strategies covered here.
FAQ
What is technical analysis in simple terms?
Technical analysis is the study of past price and volume data on a chart to forecast where an asset’s price may move next. It assumes that price reflects all available market information and that patterns repeat because human behavior does not change.
How does technical analysis differ from fundamental analysis?
Fundamental analysis evaluates a company’s financial health, earnings, and economic factors. Technical analysis ignores those factors and focuses only on price and volume patterns to time trading decisions.
What are the most common technical analysis tools?
The most widely used tools are candlestick charts, moving averages, RSI, MACD, Bollinger Bands, and support/resistance levels. Each serves a different purpose, from identifying trends to spotting momentum shifts.
Is technical analysis reliable?
Technical analysis is a useful decision-support tool, but its effectiveness is debated. Research results are mixed, and no indicator is foolproof. Reliability improves significantly when traders use multiple confirming signals and strict risk management rules.
Can beginners use technical analysis?
Yes. Beginners can start with basic tools like moving averages and RSI on a daily chart. The key is to keep the approach simple, define clear rules before entering any trade, and review results consistently to improve over time.