TL;DR:
- Data aggregation consolidates market data from multiple sources to improve trade execution, liquidity visibility, and analysis accuracy. It relies on proper normalization and helps distinguish market-wide from stock-specific signals to enhance risk management. Automation of the aggregation process enables faster decision-making but requires careful infrastructure to avoid data distortions.
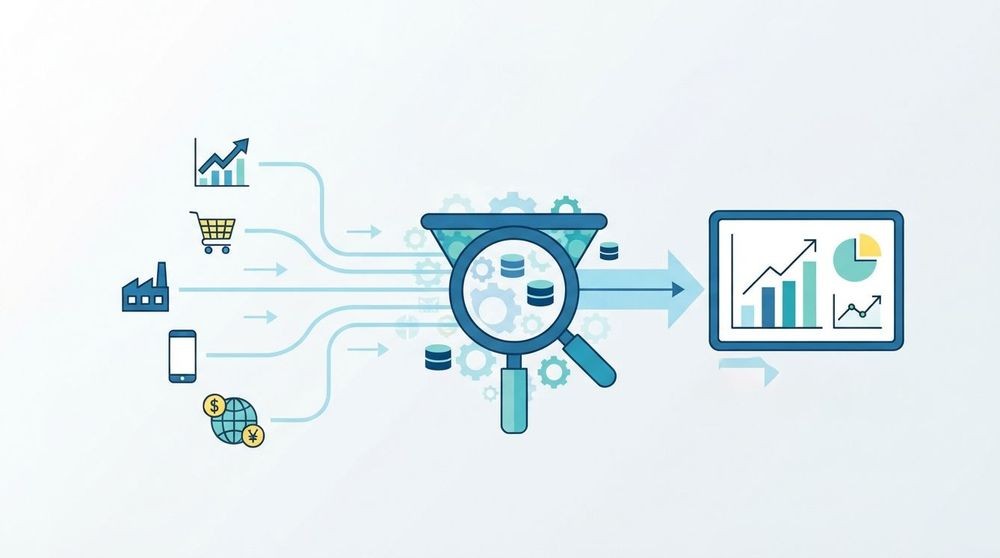
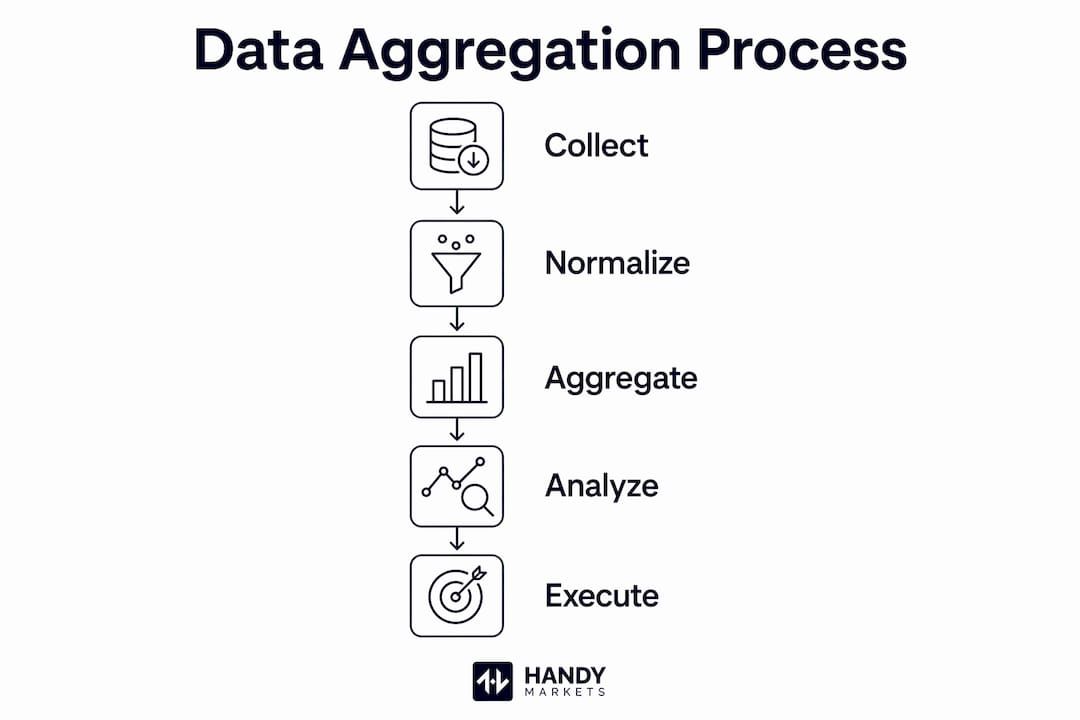
Data aggregation is defined as the systematic collection, normalization, and summarization of market data from multiple sources to produce consolidated, reliable intelligence that drives market efficiency. Financial professionals who understand this process gain a structural edge. The role of data aggregation in markets extends far beyond convenience. It determines execution quality, shapes liquidity visibility, and powers the information flow that separates informed decisions from costly guesses. Platforms like Handy Markets are built on this foundation, pulling live prices across cryptocurrencies, stocks, forex, commodities, and indices into a single, actionable view.
How does data aggregation improve liquidity and price execution in markets?
Liquidity aggregation is the process of consolidating bid/ask quotes from multiple sources, including prime brokers, electronic communication networks (ECNs), and tier-1 banks, into a unified order book. This consolidation gives traders a deeper, more accurate picture of available liquidity at any given moment. Without it, you are trading against a partial view of the market.

The technical quality of that consolidation determines everything. Efficient liquidity aggregation improves execution stability by nearly 99% compared to single-source feeds during periods of market volatility. That figure reflects what happens when stale quotes and outlier prices are filtered out before they reach the order book. A single bad quote from one provider can widen spreads artificially. Aggregation removes that risk.
For brokerages, deeper liquidity pools translate directly into better handling of large-ticket orders and stronger client retention. A firm routing a $10 million equity block through an aggregated feed gets tighter fills than one relying on a single prime broker. That difference compounds over thousands of trades.
Key technical steps that make aggregation work in practice:
- Symbol mapping: Aligning ticker symbols across providers so “AAPL” from one feed matches “AAPL” from another without duplication or conflict.
- Timestamp synchronization: Ensuring quotes from different sources share a common time reference, preventing stale data from appearing current.
- Quote validation: Filtering prices that fall outside statistically reasonable ranges before they enter the aggregated book.
- Outlier removal: Discarding quotes that deviate significantly from the consensus price across providers.
Pro Tip: Before evaluating any aggregated data feed, confirm that the provider performs symbol mapping and timestamp synchronization at the infrastructure level. Feeds that skip these steps produce clean-looking data that quietly degrades execution quality under volatility.
The market aggregation guide from Handy Markets covers how consolidated quotes tighten spreads and improve order execution in practical terms.
What is the role of data aggregation in information flow and volatility analysis?
Aggregated market data does more than improve execution. It enables a deeper class of analysis: measuring the actual flow of information through a market. Every order placed, modified, or canceled carries a signal. Aggregation makes it possible to extract that signal at scale.
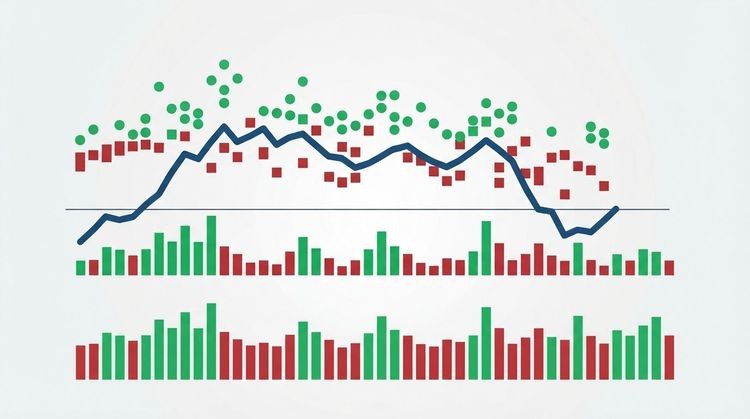
Dynamic information flow analysis from millions of orders reveals a countercyclical pattern that correlates with overall market volatility. This means information flow tends to rise when prices are falling and markets are stressed. That relationship is not random. It reflects the behavior of informed traders repositioning during uncertainty.
Aggregation allows analysts to decompose that information flow into two distinct components:
- Systematic information: Market-wide effects that move all stocks together, aligned with CAPM R² values and benchmarks like the SPY volatility index.
- Idiosyncratic information: Stock-specific signals that are independent of broader market moves and reflect company-level developments.
This distinction matters enormously for portfolio construction. A manager who can separate systematic from idiosyncratic information flow builds more resilient diversification strategies. The CAPM framework becomes more useful when you can measure how much of a stock’s movement is market-driven versus company-driven in real time.
Volatility analysis also benefits directly. When aggregated data shows a spike in idiosyncratic information flow for a single stock, that is an early signal of company-specific risk. When systematic information flow spikes across the board, it signals a market-wide stress event. Both signals require different responses, and aggregation is what makes them visible.
How does modern market data infrastructure rely on aggregation for real-time decisions?
The price you see on a chart is not raw data. It is the final output of a multi-stage processing pipeline that most traders never think about. Understanding that pipeline changes how you interpret market data.
The 6-stage market data pipeline moves from raw market event through exchange update, processing, aggregation, platform delivery, and final display. Each stage adds structure and removes noise. Aggregation sits at the center of this pipeline, where data from multiple exchanges and providers is combined into a single, normalized stream.
Here is how each stage functions:
- Market event: A trade executes or an order is placed at an exchange.
- Exchange update: The exchange broadcasts the event through its data feed.
- Processing: The raw feed is parsed, decoded, and prepared for normalization.
- Aggregation: Data from multiple exchanges and providers is combined, deduplicated, and validated.
- Platform delivery: The aggregated stream is distributed to trading platforms and analytics tools.
- Final display: The trader sees a clean, current price on their chart or terminal.
Without proper normalization at stage four, the entire pipeline degrades. High-quality aggregation requires symbol mapping, timestamp synchronization, currency conversion, and decimal precision adjustment to prevent inconsistencies that compromise algorithmic trading.
The speed advantage of automated aggregation is significant. Manual data comparison takes 2–3 weeks. Automated aggregation pipelines compress that to near-instantaneous decision-making. For algorithmic traders and high-frequency strategies, that compression is not a convenience. It is the entire business model.
The real-time market data guide from Handy Markets explains how this six-stage infrastructure supports timely trading decisions in practical terms.
Pro Tip: When a platform shows a price that looks “off” during a volatile session, the problem is almost always upstream in the aggregation layer. A feed that skips quote validation will pass erroneous prices directly to your chart. Always verify your data provider’s normalization practices before relying on their feed for execution.
Modern fintech payment infrastructure follows similar aggregation principles, combining multi-source transaction data into real-time, normalized streams for cross-border financial decisions.
What are the benefits and potential pitfalls of data aggregation in investment strategies?
Aggregation delivers clear benefits, but it also introduces risks that analysts often underestimate. The benefits are well-documented. Aggregation transforms granular market data into structured summaries that support faster decisions and cleaner analysis. The risks are less discussed but equally real.
Core benefits of data aggregation for market analysts:
- Faster query performance: Summarized datasets run analytical queries in seconds rather than hours.
- Analytical clarity: Removing noise from raw data makes trends and patterns visible that would otherwise be buried.
- Liquidity visibility: Consolidated order books show true market depth across all providers simultaneously.
- Risk segmentation: Separating systematic from idiosyncratic signals supports more precise portfolio hedging.
The pitfalls deserve equal attention. Poorly designed aggregation models can generate false signals by smoothing out exactly the granular detail that carries the most information. An aggregation model that averages prices across providers without weighting by volume will distort the true consensus price. That distortion can look like a trend when it is actually an artifact of the model.
Decentralized aggregation addresses one specific version of this problem. Chainlink’s medianization approach removes outliers and malicious inputs across independent nodes, producing tamper-resistant pricing data for financial derivatives and decentralized finance contracts. The median calculation is more resistant to manipulation than a simple average because a single bad actor cannot move the median without controlling the majority of nodes.
| Approach | Strength | Risk |
|---|---|---|
| Centralized averaging | Simple, fast, widely supported | Vulnerable to outlier distortion and single-source failure |
| Weighted volume averaging | Reflects true market consensus more accurately | Requires reliable volume data from all providers |
| Decentralized medianization | Tamper-resistant, removes malicious inputs | Higher infrastructure complexity and latency |
| Manual aggregation | Full analyst control over methodology | Introduces delays of 2–3 weeks per analysis cycle |
The best practice is to match your aggregation method to your use case. Algorithmic trading requires weighted volume averaging with strict timestamp controls. Decentralized finance contracts require medianization. Fundamental analysis can tolerate simpler approaches. Using the wrong method for the wrong context is where catastrophic data misinterpretation originates.
Key Takeaways
Effective data aggregation is the foundation of reliable market analysis, and the quality of your aggregation method determines the quality of every decision built on top of it.
| Point | Details |
|---|---|
| Execution stability | Aggregated feeds improve execution stability by nearly 99% versus single-source feeds during volatility. |
| Normalization is non-negotiable | Symbol mapping, timestamp synchronization, and quote validation prevent silent data degradation. |
| Information flow analysis | Aggregation separates systematic from idiosyncratic signals, enabling more precise risk management. |
| Pipeline awareness | The price on your chart is the output of a 6-stage pipeline. Failures in aggregation corrupt that output. |
| Method-to-use-case matching | Decentralized medianization suits derivatives; weighted averaging suits algorithmic trading. |
The aggregation layer is where market intelligence actually lives
We have spent years watching analysts focus on the outputs of market data while paying almost no attention to the process that produces those outputs. That is a structural blind spot. The aggregation layer is where the real work happens, and most trading desks treat it as invisible infrastructure.
The shift toward real-time aggregated data has fundamentally changed how trading desks operate. Decisions that once required a week of manual data reconciliation now happen in seconds. That speed creates an asymmetry. Analysts who understand what their aggregation pipeline is actually doing can spot data artifacts before acting on them. Analysts who treat the displayed price as ground truth are one bad feed away from a costly mistake.
The emerging trend worth watching is decentralized data aggregation. As financial derivatives increasingly settle against on-chain price feeds, the provenance of aggregated data becomes a legal and financial question, not just a technical one. Knowing where your price came from and how it was constructed is becoming a compliance requirement, not an optional audit.
The balance between automation and analyst expertise is the real tension in this space. Automated aggregation is faster and more consistent than any human process. But automated systems fail in ways that humans do not always anticipate. The analysts who add the most value are the ones who understand the pipeline well enough to know when to trust it and when to question it.
Real-time aggregated data, all in one place
Handy Markets pulls live prices across cryptocurrencies, stocks, forex, commodities, and indices into a single, personalized view. The platform is built on the same aggregation principles this article covers: normalized, real-time data from multiple sources, delivered without the noise.
You can set price alerts across markets through Telegram, Discord, Slack, SMS, Webhook, and Email, so critical moves reach you the moment they happen. Whether you are monitoring a single asset or tracking a full portfolio across asset classes, Handy Markets gives you the aggregated market visibility that informed decisions require. Setup takes minutes, and the data is always current.
FAQ
What is data aggregation in financial markets?
Data aggregation in financial markets is the process of collecting, normalizing, and summarizing price and order data from multiple sources into a single, reliable stream. It powers liquidity consolidation, price discovery, and real-time analytics across exchanges and asset classes.
How does data aggregation improve trade execution quality?
Aggregated feeds improve execution stability by nearly 99% compared to single-source feeds during volatility, by filtering stale quotes and outliers before they reach the order book. This tightens spreads and increases fill rates for both retail and institutional orders.
What are the biggest risks of poorly designed data aggregation?
Poorly designed aggregation models can generate false signals by smoothing out granular detail that carries real market information. An averaging model that ignores volume weighting or skips outlier removal will distort the true consensus price and mislead analysts.
What is the 6-stage market data pipeline?
The 6-stage pipeline moves from market event through exchange update, processing, aggregation, platform delivery, and final display. Aggregation sits at stage four, where data from multiple providers is combined, deduplicated, and validated before reaching traders.
How does decentralized aggregation protect data integrity?
Decentralized aggregation uses statistical medianization across independent nodes to remove outliers and malicious inputs. Chainlink’s approach applies this method to financial derivatives, producing tamper-resistant pricing data that a single bad actor cannot manipulate without controlling the majority of nodes.