TL;DR:
- Market depth reflects the total volume of resting orders at various price levels, indicating a market’s true capacity to absorb large trades. High trading volume does not necessarily equate to deep market depth, which directly affects trade execution and slippage risk. Utilizing real-time order book data and understanding the dynamic nature of depth enables traders to make more informed, precise decisions.
You watch a stock rack up millions of shares traded and assume the price will move smoothly. Then you place a large order and watch your execution price slip further than expected. This is the trap of confusing volume with depth. Market depth measures a market’s ability to absorb large buy and sell orders without significantly affecting price, and it tells a very different story than volume alone. Understanding market depth is one of the most practical edges a trader can develop, and this guide will show you exactly how it works.
Table of Contents
- What is market depth and why it matters
- How market depth is displayed and measured
- The impact of market depth on trade execution and price movement
- Navigating nuances: top-of-book vs. full-depth liquidity and dynamic nature
- How to use market depth data for smarter trading decisions
- A fresh perspective on market depth: beyond the textbook
- How Handy.Markets helps you monitor market depth and liquidity
- Frequently asked questions
Key Takeaways
| Point | Details |
|---|---|
| Market depth explained | Market depth shows buy and sell order sizes across price levels, indicating true liquidity beyond volume. |
| Effect on execution | Shallow depth can lead to worse prices when large orders consume available liquidity at best quotes. |
| Dynamic market data | Market depth changes in real-time, so traders should continuously monitor it to manage risks. |
| Advanced trading insight | Savvy traders combine market depth with order flow and advanced analytics to anticipate price moves. |
| Practical tools help | Access to Level 2 data and price alerts aids in applying market depth knowledge effectively. |
What is market depth and why it matters
Market depth refers to the total quantity of resting buy and sell orders sitting at various price levels in a market at any given moment. Think of it as a window into the market’s backbone. While the last traded price tells you where a transaction just happened, market depth tells you what would happen next if you placed a large order right now.
Market depth measures a market’s ability to absorb relatively large buy and sell orders without significantly affecting the security’s price. A deep market has thick layers of orders stacked close to the current price, so even a big trade barely moves the needle. A shallow market has thin layers, and a single sizable order can shift prices sharply.
Here is where many traders get tripped up:
- High trading volume does not equal deep market depth. A stock can trade millions of shares per day in bursts, but those trades may concentrate in small windows, leaving thin order books between events.
- Order imbalances cause volatility even in high-volume markets. When buy orders far outnumber sell orders at current prices, even modest buy pressure can spike prices fast.
- Depth is a better measure of execution risk than last traded price or daily volume, especially for traders placing orders above a few thousand shares.
- Depth reflects capacity, not just activity. Volume is the record of what happened; depth is the map of what can happen.
Thinking about market volatility strategies becomes much more meaningful once you understand the depth behind the price action. Without it, you are making execution decisions with half the picture.
Now that we know why market depth matters, let’s explore how traders view and measure it.
How market depth is displayed and measured
Market depth is visualized through two closely related tools: the order book and the depth chart. Both are live, constantly updating feeds that show the demand and supply structure behind current prices.
Market depth data is typically displayed as Level 2 views showing multiple bid and ask price levels and quantities beyond the best Level 1 bid/ask. Level 1 data only shows you the single best bid (highest buy offer) and best ask (lowest sell offer). Level 2 pulls back the curtain and shows you ten, twenty, or more price levels on each side.
Here is what you are reading when you look at an order book:
- Bids: Buy orders waiting to be filled, ranked from highest to lowest price. The top bid is the most a buyer is willing to pay right now.
- Asks: Sell orders waiting to be filled, ranked from lowest to highest price. The top ask is the least a seller will accept.
- Size at each level: The number of shares, contracts, or units available at that specific price. This is the depth figure itself.
- Order book updates in real time, reflecting new orders placed, orders canceled, and trades executed. It is a living, breathing feed, not a static screen.
- Depth charts plot cumulative bid and ask volume visually, giving you an instant sense of whether buyers or sellers have more firepower near the current price.
For a practical starting point, a solid real-time market data guide can show you how to access and interpret these feeds across different asset classes.
With this visualization in mind, let’s examine how shallow versus deep markets affect trade execution.
The impact of market depth on trade execution and price movement
This is where market depth stops being abstract and starts costing or saving you money. The mechanics are straightforward but their consequences are significant.
When you place a market order, your broker fills it against the best available price in the order book. If your order size fits within the quantity resting at the top ask (for buys) or top bid (for sells), you get a clean fill at that price. The problem starts when your order is larger than what is sitting there.

Shallow market depth can cause a market order to “walk the book,” executing at worse prices and increasing average cost. This means your order consumes the best price level, then moves to the next, then the next, each one slightly worse, until your full order is filled. The result is a higher average buy price or lower average sell price than you expected.
Consider a concrete example. A hypothetical sell of 10,000 shares moving through bids can lower the price approximately 2%, illustrating the price impact of low depth. In a $50 stock, that is a $1 drop triggered by a single trade. Now scale that to institutional positions and the cost becomes very real.
Key execution takeaways:
- Price impact depends on liquidity depth near current price, not just on broader market conditions.
- Walking the book is not a rare edge case. It happens routinely in mid-cap stocks, smaller crypto tokens, and off-hours forex trading.
- Real-time depth monitoring helps you spot thin order books before you commit, giving you the option to split orders or wait for better conditions.
- Slippage compounds over time. Active traders who ignore depth on every entry and exit accumulate a significant drag on performance.
“The market may look liquid from the outside, but a few large orders can reveal just how thin the cushion really is.”
Pro Tip: Before placing a large order, check how much volume is resting at the top two or three price levels on each side. If your order size exceeds what is available there, expect slippage and plan accordingly.
Applying this understanding connects directly to mastering market trends because depth signals often anticipate short-term price direction before volume picks up.
Understanding execution impact sets the stage for exploring market depth nuances and comparisons.
Navigating nuances: top-of-book vs. full-depth liquidity and dynamic nature
Not all liquidity is created equal, and the difference between top-of-book and full-depth liquidity is one of the most underappreciated distinctions in trading.
Traders distinguish between top-of-book liquidity and full-depth liquidity; a market may have tight spreads but be vulnerable beyond its best quotes. A tight bid/ask spread tells you the best available prices are close together. That looks healthy. But if only 200 shares sit at those best prices, and you need 2,000, the spread becomes largely irrelevant to your execution quality.
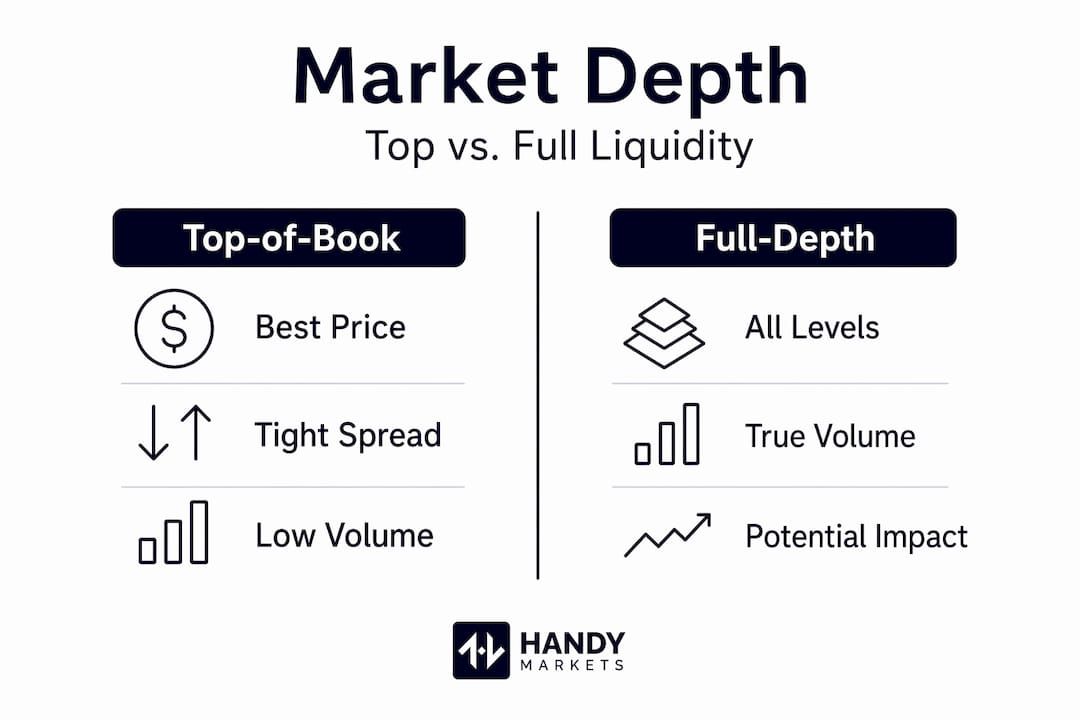
| Feature | Top-of-book liquidity | Full-depth liquidity |
|---|---|---|
| What it shows | Best bid and ask price and size | All price levels and sizes across the book |
| Spread visibility | Yes, tight spreads are visible | Spread visible plus deeper context |
| Execution risk for large orders | High if top levels are thin | Clearer picture of total capacity |
| Best for | Small retail orders | Larger trades, institutional orders |
| Misleading factor | Looks liquid, may be fragile | Requires Level 2 data access |
Market depth is dynamic, with orders constantly added, canceled, or filled; snapshots can mislead without real-time updates. This is a critical point many newer traders miss. An order book screenshot from 30 seconds ago may not reflect current conditions, particularly during earnings announcements, economic data releases, or sudden news events.
Key points to keep in mind:
- Large traders sometimes post and cancel orders rapidly to test market reaction, creating phantom liquidity.
- Order book dynamics shift fastest during the first and last 30 minutes of a trading session and around scheduled news events.
- Static snapshots of depth charts can give a false sense of security in volatile conditions.
- Combining depth analysis with market fluctuation analysis methods gives you a more complete real-time picture.
Pro Tip: Always assess whether your order size fits comfortably within resting liquidity at your intended price level before executing. If it does not, consider splitting into smaller tranches or using limit orders to reduce price impact.
With an understanding of these nuances, let’s see how you can practically use market depth data in trading.
How to use market depth data for smarter trading decisions
Market depth helps traders understand liquidity, execution quality, and potential short-term price movement risk, especially for active traders. Here is a practical framework for putting it to work.
- Check depth before sizing your order. Before entering any position above a few hundred shares or units, look at how much liquidity sits at the top two to three price levels. If your order exceeds that, you will pay a liquidity premium through slippage.
- Monitor depth changes during volatile events. Economic releases, earnings calls, and geopolitical news can drain order books fast. Watching depth in real time during these windows tells you whether the market can absorb reactions or is set up for sharp moves.
- Use clustered resting orders as support and resistance signals. When you see unusually large limit orders stacked at a particular price level, that zone often acts as a temporary floor or ceiling, since other traders recognize it too.
- Time entries and exits around depth conditions. Entering when depth is thick means less slippage. Waiting for a replenishment of bids after a sell-off can signal a smarter entry point than chasing price momentum.
- Combine depth data with price alerts. Setting alerts at key price levels through a market monitoring platform means you get notified when prices reach zones of interest, giving you time to check depth before committing.
- Pair depth analysis with broader market context. Market depth is one layer. Order flow, trend direction, and macro conditions all interact with it.
Pro Tip: Use a small test order, a fraction of your intended position, to probe actual liquidity before committing fully. Real fills tell you more than any order book snapshot.
A fresh perspective on market depth: beyond the textbook
Here is what most introductory guides will not tell you: market depth in 2026 is not the clean, human-driven structure it once was. A substantial portion of the orders you see in any equity or crypto order book are placed, modified, and canceled by algorithms operating in milliseconds. This means the “depth” you are reading is partly real and partly a performance.
High-frequency trading firms and market makers use order placement to signal intentions and test other participants’ reactions. What looks like solid buy-side support at a key price level can vanish the moment a large order appears. This is sometimes called “order book spoofing,” and while it is illegal in regulated markets, subtler forms of tactical order placement are routine and legal.
The practical implication is this: raw market depth data is valuable, but it rewards skepticism. Where market moves really begin is often in the interaction between order flow, algorithmic positioning, and behavioral momentum, not in a single snapshot of bids and asks.
Advanced traders integrate market depth with order flow analysis, watching for large prints in time and sales data that do not match what the order book suggested was available. When a price level holds despite repeated testing, that is real depth. When it dissolves the moment pressure arrives, it was likely tactical positioning.
Keeping up with market analysis techniques that incorporate order flow, algorithmic behavior, and real-time depth creates a feedback loop that genuinely improves your read on short-term price dynamics. The traders who use market depth most effectively treat it as a living signal, not a static measurement.
Understanding market depth’s complex interactions is not about mastering one tool. It is about developing a feel for the market’s heartbeat at the microstructure level. That takes practice, real-time observation, and a willingness to go past what the textbook shows.
How Handy.Markets helps you monitor market depth and liquidity
Knowing what market depth is and being able to act on it in real time are two very different things. That gap is exactly what Handy.Markets is built to close.
With Handy.Markets, you can track multiple financial markets across stocks, crypto, forex, commodities, and indices in one place, giving you instant visibility into price movements and liquidity conditions across asset classes. The platform lets you set up price alerts across Telegram, Discord, Slack, SMS, Webhook, and Email, so when a market moves into a depth zone you care about, you know immediately. Whether you are monitoring stocks live quotes or watching a crypto token’s order dynamics, Handy.Markets delivers the real-time data feed you need to make depth-informed decisions without juggling multiple tools.
FAQ
What is the difference between market depth and trading volume?
Market depth shows the quantity of buy and sell orders at different price levels, while trading volume measures total shares or contracts traded. High volume does not imply that a security has good market depth, since trades can be concentrated and leave thin order books between activity windows.
Where can I find market depth data when trading?
Market depth data is typically displayed as Level 2 views showing multiple bid and ask price levels beyond the best Level 1 bid/ask, available through most professional trading platforms and market data services.
How does shallow market depth affect my trade execution?
If your order size is larger than available volume at the top price, execution moves to the next price level, causing a worse average execution price. This is called walking the book, and it quietly inflates the real cost of your trades.
Why is market depth dynamic and why does it matter?
Market depth is dynamic, with orders constantly added, canceled, and filled, so a single snapshot can be misleading without real-time updates. Monitoring depth live, especially around news and high-volatility events, is the only reliable way to understand true execution risk.