
The fastest, least error-prone way to track stocks and crypto together is a consolidated portfolio tracker that links your brokerage and exchange accounts, accepts CSV imports, converts multiple currencies, and calculates cost basis per lot. A disciplined spreadsheet remains the better tool if you want granular tax-lot control or custom risk formulas Excel handles well, but most investors outgrow that setup fast.
The decisive capabilities to look for:
- Account linking through API or read-only keys, plus CSV import for anything that won’t connect directly
- Cost-basis tracking per lot, with multi-currency conversion for FX-adjusted returns
- Real-time or near-real-time price alerts across the assets you actually hold
Statistic Callout: Dividends have historically made up roughly 40% of the S&P 500’s total return, which is exactly the kind of detail a tracker that only shows price movement will miss entirely.
Key Takeaways
A consolidated tracker with account linking, cost-basis-per-lot calculations, and multi-channel alerts beats manual tracking for most investors, while spreadsheets still win on tax-lot precision and custom risk analysis.
| Point | Details |
|---|---|
| Pick the right base tool | Use a consolidated tracker for daily monitoring; keep Excel or Sheets for tax-lot decisions and custom risk metrics. |
| Demand lot-level cost basis | Cost basis per lot determines what you owe in taxes and whether a sale actually makes sense. |
| Verify before you trust the total | Reconcile your tracker’s grand total against real account balances monthly to catch missing trades or FX errors. |
| Secure every linked account | Use read-only API keys, enable two-factor authentication, and review app permissions periodically. |
| Handy Markets covers the checklist | Handy Markets offers multi-asset coverage, CSV import, and alerts via Telegram, Discord, Slack, SMS, webhook, and email. |
Table of Contents
- Automated Tracker or Manual Spreadsheet: Which Fits Your Portfolio?
- What Should a Multi-Asset Tracker Actually Include?
- How Do You Set Up a Combined Stocks-and-Crypto View?
- Which Metrics Actually Matter Once You’re Tracking Everything?
- Is It Safe to Link Your Brokerage and Exchange Accounts?
- Why Some Serious Investors Still Trust a Spreadsheet Over an App
- What Most Guides Get Wrong About Tracking Stocks and Crypto
- If You Want a Ready Solution: How Handy Markets Meets the Checklist
- Sources
Automated Tracker or Manual Spreadsheet: Which Fits Your Portfolio?
An automated tracker pulls your holdings together through API connections or CSV uploads, then shows unified allocation, computes cost basis, and pushes alerts when prices move. It does the reconciliation work for you, continuously, without you opening a single account dashboard.
A spreadsheet still earns its place for investors who want bespoke control. Excel can calculate standard deviation, percentage returns, and detailed profit-and-loss breakdowns, which makes it genuinely useful for lot-level tax strategy and custom risk metrics no off-the-shelf tool offers.
Here’s how the two stack up:
- Effort: Trackers update automatically; spreadsheets need manual entry every time you trade.
- Accuracy: Trackers reduce manual error but depend on clean data feeds; spreadsheets are only as accurate as your last update.
- Customization: Spreadsheets win outright, trackers offer templates.
- Cost: Spreadsheets are free or already owned; trackers range from free tiers to paid subscriptions.
- Data latency: Trackers can offer real-time feeds; spreadsheets are always as current as your last manual pull.
Pro Tip: Run a tracker for daily monitoring and alerts, then export data into a spreadsheet quarterly for tax-lot review and custom risk analysis. You get speed and precision without picking just one.
What Should a Multi-Asset Tracker Actually Include?
Before you link a single account, check the tool against this list. Skipping any of these items usually means discovering the gap the hard way, mid tax season or mid rally.
- Asset coverage: Stocks, ETFs, and major crypto exchanges, plus on-chain wallets if you hold tokens outside an exchange.
- Account linking: API keys, OAuth broker connections, or CSV import. Dedicated trackers typically support all three, plus manual entry for non-traded assets like real estate or private equity.
- Portfolio math: Cost basis per lot, realized versus unrealized profit and loss, and FX-adjusted returns if you hold assets in more than one currency.
- Alerts: Email, webhook, Telegram, Discord, Slack, or SMS, so you’re not glued to a browser tab.
- Pricing shape: Free tiers often cap the number of linked accounts or delay data; paid tiers usually unlock real-time feeds and more integrations.
- Extras: Export and backup options, tax-report generation, and both mobile and web access.
Reviewing this list against Handy Markets’s own multi-asset market coverage is a useful way to see how a live platform maps to each requirement.
How Do You Set Up a Combined Stocks-and-Crypto View?
Getting one clean dashboard takes about thirty minutes if you have your account statements handy. Rushing this step is exactly how gaps in your data creep in later.
- Inventory every account. List each brokerage, exchange, and wallet, plus anything held outside a platform.
- Pick a base currency and cost-basis method. FIFO, LIFO, or specific-lot identification, decided before you import anything.
- Connect accounts or import CSVs. Use API links where available; fall back to CSV for exchanges or brokers without a supported connection.
- Add manual entries for OTC positions, private tokens, or anything a connection can’t reach.
- Verify prices and FX history. Historical FX rates at the time of purchase matter for accurate returns, not just the current exchange rate.
- Import dividends and corporate actions, since these affect your real cost basis and total return.
- Configure alerts. Set price thresholds, percentage moves, and allocation-drift triggers, then choose delivery channels. Handy Markets lets you route alerts through Telegram, Discord, Slack, SMS, webhook, or email, so you’re not tied to checking one app.
- Reconcile the total. Compare your tracker’s grand total against the sum of your actual account balances to catch missing trades or FX mismatches.
Pro Tip: Export a snapshot of your portfolio before any major import or account reconnection. If a sync goes wrong, you’ll have a clean audit trail to restore from.
Which Metrics Actually Matter Once You’re Tracking Everything?
Cost basis per lot sits at the top of the list. It determines what you owe at tax time and whether selling a position now actually makes financial sense.
Beyond that, watch realized versus unrealized gains, total return including dividends and staking rewards, and allocation by asset class. FX-adjusted returns deserve attention too, since currency swings can flatter or flatten your real performance without you noticing. On the risk side, standard deviation and drawdown give you a read on how bumpy the ride has actually been, not just where it ended up.
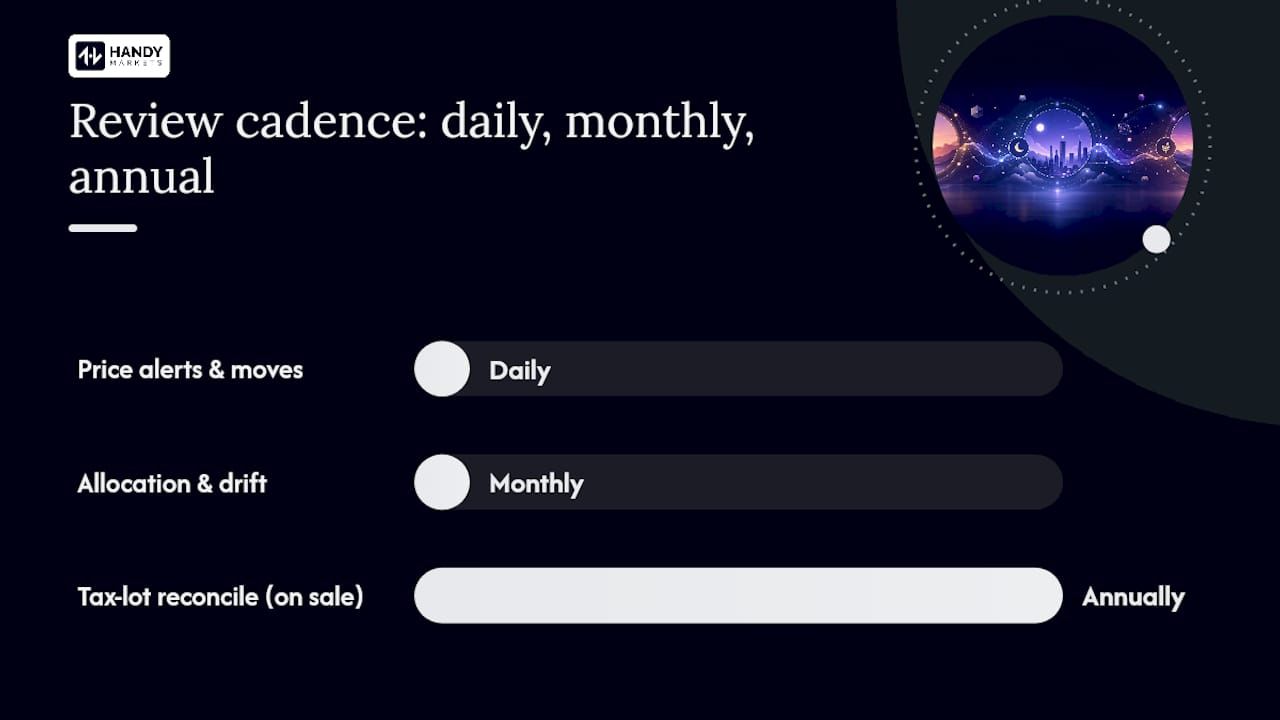
- Check price alerts and daily moves: daily
- Review allocation and drift against targets: monthly
- Reconcile tax lots and pull tax reports: annually, or whenever you sell
A guide to tracking asset volatility across markets walks through how standard deviation and drawdown apply differently to stocks versus crypto, which move on very different timelines.
Is It Safe to Link Your Brokerage and Exchange Accounts?
Before you connect anything, find out whether the platform stores your actual credentials or uses read-only API keys and broker OAuth instead. Read-only access is the safer standard: it lets a tracker see your balances without ever being able to place a trade or move funds.
Check the data-latency disclaimer too. Some data feeds are genuinely real-time; others are delayed or indicative, and delayed data is often fine for a long-term view but risky if you’re making same-day decisions off it. Illiquid tokens are another trap, since a single low-volume exchange price can distort your whole crypto valuation.
- Enable two-factor authentication on every linked account, not just your main exchange.
- Use read-only keys wherever the option exists.
- Review connected-app permissions every few months and revoke anything you no longer use.
- Export your portfolio data periodically as a backup independent of any single platform.
Why Some Serious Investors Still Trust a Spreadsheet Over an App
Automated dashboards are convenient, but they can create distance between you and your own numbers. Manual entry forces a kind of engagement that automation quietly removes.
Investors who build their own tracking sheets tend to understand their true cost basis and real returns more precisely, because the discipline of manual entry keeps them close to every trade, fee, and dividend that shaped the outcome.
That’s the case for keeping Excel or Sheets in your toolkit even if you run a dashboard day to day: use the automated tracker for daily monitoring and reconciliation, and pull data into a spreadsheet when you need lot-level tax decisions or a custom risk calculation no app template offers. The two aren’t competitors. They cover different jobs.
What Most Guides Get Wrong About Tracking Stocks and Crypto
Most advice on this topic treats the tracker-versus-spreadsheet choice as binary, and that framing misleads people into picking one and abandoning the other too early. The research points somewhere more useful: reconciliation, not tool choice, is what actually protects your returns.

A dashboard that looks accurate isn’t the same as one that is accurate. Delayed feeds, missed CSV imports, and FX rates pulled at the wrong moment all produce numbers that look plausible and are quietly wrong. That’s the gap conventional advice skips past.
If you take one thing from this guide, prioritize the reconciliation habit before the tool. Check your tracker’s total against your actual account balances monthly, not just when something looks off. Spreadsheets still deserve a seat at the table for tax-lot decisions Excel handles with real precision, but for the daily job of watching prices move across a mixed portfolio, a consolidated view saves hours a live spreadsheet demands you spend manually. Automated platforms for rebalancing crypto allocations show the same principle: automation handles the repetitive math, you handle judgment.
If You Want a Ready Solution: How Handy Markets Meets the Checklist
Setting up manual trackers for every account gets old fast, especially once your crypto holdings span more than one exchange. Handy Markets gives you a single dashboard for stocks, crypto, forex, indices, and commodities, without asking you to rebuild your tracking spreadsheet from scratch every quarter.
The platform maps directly onto the checklist covered above: real-time price tracking across asset classes, quick account setup with CSV import support, and alerts delivered through Telegram, Discord, Slack, SMS, webhook, or email so you never need to keep a browser tab open all day. The dedicated crypto page shows live prices and charts with instant notification setup for the tokens you actually hold, and everything works across both mobile and web.
Pricing runs from a free tier for basic monitoring up to paid plans for higher alert volumes and faster data. If you’re ready to stop juggling five browser tabs and one spreadsheet, set up your first price alert and see your stocks and crypto in one place today.
Sources
- Master Investment Tracking and Analysis With Excel
- How to Track Your Investment Portfolio: Complete Guide (2026) | AllInvestView
- Portfolio Tracking: The Complete Guide to Monitoring Your Investments — FlashFi
This article is general information, not a substitute for advice from a qualified financial advisor. Consult a qualified financial professional about your own circumstances before acting on anything here.