TL;DR:
- Volatility indicates market stress and helps traders anticipate price movements.
- Using indicators like ATR and VIX assists in measuring and managing market risk.
- Consistent monitoring and tailored tools improve decision-making and protect capital across markets.
You’re watching your portfolio when a sudden price swing erases gains you spent weeks building. It happens in stocks, crypto, and forex alike, and it always feels like it came out of nowhere. But here’s the thing: volatility rarely appears without warning signs if you know where to look. Tracking asset volatility effectively means you stop reacting and start anticipating. In this guide, we’ll walk through exactly what volatility is, which tools measure it best, and a repeatable step-by-step process you can apply across any market you trade or invest in.
Table of Contents
- What is asset volatility and why does it matter?
- Essential tools and data for tracking volatility
- Step-by-step: Tracking asset volatility across markets
- Troubleshooting and maximizing your volatility tracking
- Our perspective: The overlooked truths about volatility tracking
- Track volatility across assets with Handy.Markets
- Frequently asked questions
Key Takeaways
| Point | Details |
|---|---|
| Volatility is crucial | Tracking volatility empowers you to protect capital and spot trading opportunities. |
| Use the right tools | Select platforms and indicators suited to your chosen markets for best results. |
| Act on timely alerts | Real-time monitoring and alerts help you respond swiftly to volatility spikes. |
| Avoid common mistakes | Filter out market ‘noise’ and use a consistent method for actionable insights. |
| Integrate with your workflow | Regular risk reviews and tailored strategies optimize your tracking over time. |
What is asset volatility and why does it matter?
Now that you know you’re not alone in facing unpredictable market moves, let’s clarify what volatility really means and why it matters. Think of volatility as the heartbeat of a market. A fast, erratic heartbeat signals stress and risk. A slow, steady one suggests calm conditions. Both have their opportunities, but you need to read the rhythm correctly to act wisely.
Volatility refers to the frequency and magnitude of price movements in a market. Technically, it’s often measured using standard deviation, which shows how far prices stray from their average over a given period. The wider the swings, the higher the volatility.
Different asset classes have very different personalities when it comes to volatility:
- Stocks can swing dramatically on earnings reports, economic data, or geopolitical events, but they tend to be more stable than crypto.
- Cryptocurrencies are notorious for jaw-dropping moves, with Bitcoin regularly posting double-digit percentage swings within a single week.
- Forex pairs have their own rhythms, driven by interest rate decisions, inflation data, and political shifts, with some pairs far more volatile than others.
So why should you track volatility consistently? Because ignoring it has real consequences. Here’s what can happen when traders skip volatility monitoring:
- Missed entries and exits: High volatility can signal the start of a powerful trend or a reversal. Without tracking it, you risk entering too late or holding too long.
- Poor position sizing: Volatility directly informs how large your position should be. High-volatility environments demand smaller sizes to protect capital.
- Surprise losses: Sudden spikes in volatility are responsible for some of the largest single-day losses traders experience.
- Emotional decisions: Without data, fear and greed take over. Volatility metrics keep you grounded in facts, not feelings.
“Tracking volatility consistently is what separates proactive traders from those who are always one step behind the market.”
When you build the habit of checking volatility strategies before and during positions, you make smarter entries, set better stop-losses, and size trades more appropriately. Volatility isn’t something to fear. It’s something to measure, respect, and ultimately use to your advantage.
Essential tools and data for tracking volatility
With a clearer understanding of volatility’s importance, the next step is finding the right tools and data to track it effectively. The good news is that a strong toolkit doesn’t require a Bloomberg terminal or a finance degree. It just requires knowing which indicators tell the real story.
Popular volatility indicators include ATR and the VIX for stocks, with custom tools for crypto and forex. Here’s a breakdown of the core options:
| Tool / Indicator | Applicable market(s) | What it measures | Best use case |
|---|---|---|---|
| ATR (Average True Range) | Stocks, crypto, forex | Price range over a set period | Setting stop-losses and gauging current volatility |
| VIX (Volatility Index) | U.S. stocks (S&P 500) | Expected 30-day volatility | Sentiment gauge and risk-on/risk-off signal |
| Bollinger Bands | All markets | Standard deviation around a moving average | Spotting breakouts and squeeze setups |
| Standard deviation | All markets | Statistical price dispersion | Baseline volatility measurement |
| Crypto Fear & Greed Index | Cryptocurrencies | Market sentiment extremes | Identifying potential reversals in crypto |
Beyond indicators, you should be collecting a consistent set of data points to build a reliable picture:
- Price and volume: Volume spikes often precede volatility spikes.
- Economic calendar events: Interest rate decisions, CPI releases, and earnings reports are volatility triggers you can plan around.
- News sentiment: Sudden news can override technicals instantly.
- Historical volatility vs. implied volatility: Comparing the two can reveal whether current pricing is overblown or underpriced.
Pro Tip: Choose platforms that integrate stock market indicators with real-time alerting. Seeing a volatility spike after the fact is useful for learning, but catching it in real time is what protects your capital and surfaces opportunities.
The right dashboard pulls all of this together in one place, so you’re not bouncing between tabs and apps when the market is moving fast.

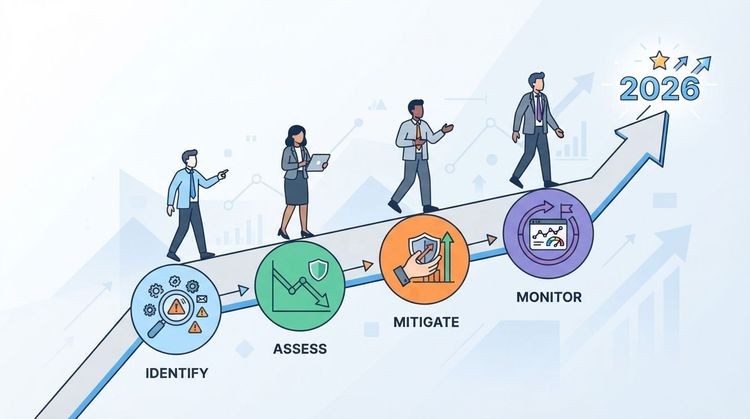
Step-by-step: Tracking asset volatility across markets
With your toolkit assembled, you’re ready to put theory into action and track volatility step by step. This process is repeatable whether you’re monitoring tech stocks, Bitcoin, or EUR/USD.
Step 1: Choose your instrument and define your scope. Decide which asset or assets you’re tracking. Narrowing your focus first prevents data overload.
Step 2: Select your timeframe. Day traders work on 5-minute to hourly charts. Swing traders use daily charts. Long-term investors look at weekly data. Your timeframe shapes which volatility signals matter.
Step 3: Apply your primary volatility indicator. Add ATR to your chart for any market. For U.S. stocks, layer in the VIX as a sentiment backdrop. Use Bollinger Bands to visualize squeeze and expansion cycles.
Step 4: Set volatility-based alerts. Real-time price monitoring and volatility alerts can help you react faster to sudden moves. Configure alerts for ATR thresholds, percentage moves, or volume surges so you’re notified before the opportunity disappears.
Step 5: Review and log your observations. Keep a simple tracking journal. Note what triggered the volatility (news, data release, technical breakout), how long it lasted, and whether your signals gave you advance warning. This builds pattern recognition over time.
![]()
Here’s how that workflow looks across three different markets:
| Step | Stocks | Crypto | Forex |
|---|---|---|---|
| Instrument | S&P 500 or individual equities | Bitcoin, Ethereum, altcoins | Major pairs (EUR/USD, GBP/JPY) |
| Timeframe | Daily / weekly | 1-hour / daily | 4-hour / daily |
| Primary indicator | ATR + VIX | ATR + Fear & Greed Index | ATR + economic calendar |
| Alert trigger | Earnings, VIX above 20 | 5% move within 24 hours | Central bank announcements |
| Review cycle | Weekly | Daily | After major sessions |
Traders who set up live market tracking alongside alerts consistently respond faster to volatility events. And speed matters. A well-timed alert can be the difference between a well-placed trade and a missed move. For a deeper look at understanding market fluctuations, including what drives them and how to interpret them, it’s worth spending time reviewing the mechanics behind the swings you’re tracking.
Troubleshooting and maximizing your volatility tracking
Even experienced traders can run into issues or confusion, so here’s how to catch errors and get the most from your volatility strategy. The most common problem isn’t a bad tool. It’s misreading the signals those tools produce.
Overreacting to noise rather than true signals is one pitfall for new volatility trackers. Here are the most frequent mistakes and how to avoid them:
- Following every blip: Not every small price move signals a volatility event. Small ATR readings or minor percentage changes are background noise, not trading signals.
- Ignoring context: A 3% stock move during low volume is very different from the same move on triple-average volume after a major news release.
- Using the wrong timeframe: Applying a day-trader’s volatility metric to a long-term portfolio leads to constant false alarms and emotional fatigue.
- Alert overload: Setting too many alerts means they all start to feel meaningless. Be selective and purposeful.
Pro Tip: To filter noise effectively, combine at least two signals before acting. For example, an ATR spike only becomes meaningful when confirmed by a volume surge or a news catalyst. One signal alone is a hint. Two signals together are a reason to pay attention.
When you encounter misleading signals, resist the urge to abandon your system. Instead, revisit the context. Check the economic calendar. Look at what happened to correlated assets. Most false signals have an explanation, and finding it improves your fluctuation analysis strategies over time.
“No indicator is perfect. The goal is not to find a signal that’s always right, but to build a process that keeps you right more often than wrong.”
Consistency is the real multiplier here. Review your tracking results weekly. Adjust indicator settings if you’re seeing too many or too few signals. And don’t overlook navigating market swings in real time, because adapting your strategy to changing market conditions is just as important as the initial setup. For traders active in currency markets, forex volatility insights offer specific guidance on the unique drivers that move exchange rates.
Our perspective: The overlooked truths about volatility tracking
Understanding common pitfalls is key, but the real edge comes from seeing what most overlook about tracking volatility. And here’s what we’ve observed: many traders treat volatility tracking as a timing tool and nothing else. That’s only half the picture.
Volatility tracking done right is risk management. It tells you not just when to enter, but how much to risk, when to hold back, and when market conditions simply don’t suit your strategy. The traders who use their in-depth volatility checklist only to time entries are leaving the most valuable information on the table.
Another overlooked truth: less is more. New traders often pile on five or six indicators hoping to catch every move. In practice, mastering two well-chosen tools, applied consistently on the right timeframe for your goals, outperforms a cluttered dashboard every time. Volatility regimes also change. What worked during a trending bull market may produce false signals during a sideways, low-volatility period. Adapting your approach when market conditions shift isn’t a weakness. It’s a core skill.
Track volatility across assets with Handy.Markets
Ready to streamline your volatility tracking? Here’s how Handy.Markets can help.
Handy.Markets brings together live prices, percentage changes, and volatility signals for stocks, crypto, forex, commodities, and indices in one clean, easy-to-navigate platform.
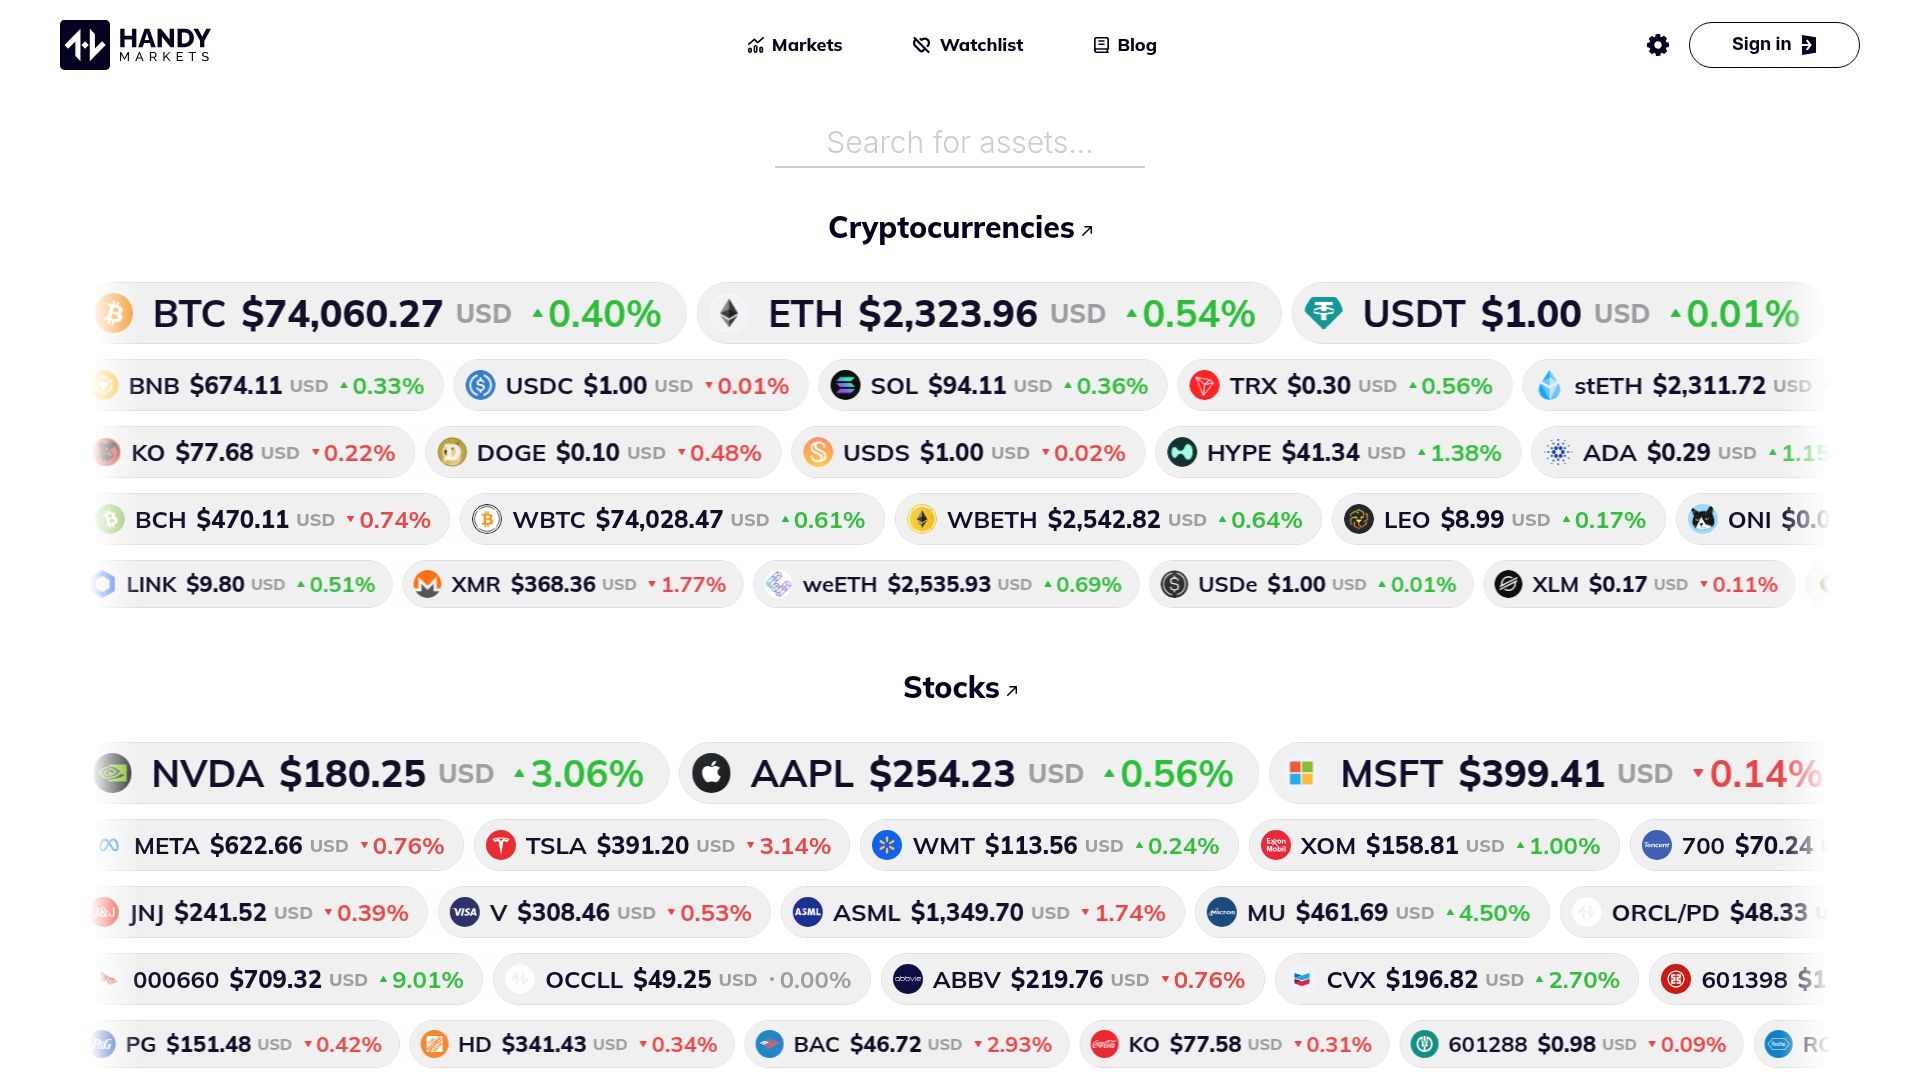
You can track multiple markets simultaneously without toggling between apps or missing a move. The platform’s alert system lets you set up price alerts across Telegram, Discord, Slack, SMS, Webhook, and Email, so critical signals reach you instantly wherever you are. Setting up is fast, and customizing your watchlist takes minutes. Whether you’re a day trader monitoring intraday spikes or a longer-term investor watching for major regime shifts, Handy.Markets gives you the real-time foundation your tracking strategy needs.
FAQ
What is the best indicator for tracking asset volatility?
ATR and VIX are popular indicators, but the best choice depends on your market and timeframe. Crypto traders often pair ATR with the Fear & Greed Index for better context.
Can I track volatility in real time?
Yes. With the right platform and alert tools, real-time volatility alerts help you react faster to sudden price swings and reduce the risk of being caught off guard.
How often should I check for volatility?
Check as often as your trading style demands. Active day traders monitor continuously, while swing traders and long-term investors typically review volatility data at the end of each session or week.
Is volatility higher in crypto than stocks or forex?
Yes, cryptocurrencies typically experience higher volatility than major stock indices or forex pairs, making real-time monitoring even more critical in that market.
Should I use the same tools for all markets?
Many tools like ATR and Bollinger Bands work across markets, but some indicators are market-specific. Combining general and tailored tools gives you the most accurate picture across asset classes.
Recommended
- Market Volatility Checklist: Strategies For Traders | Handy.Markets
- Market Fluctuation Analysis: Methods, Tools & Strategies | Handy.Markets
- What Is Market Volatility? A Practical Guide For Traders | Handy.Markets
- Mastering Volatility In Investing: A Beginner’s Guide To Navigating Market Swings In 2025 | Handy.Markets