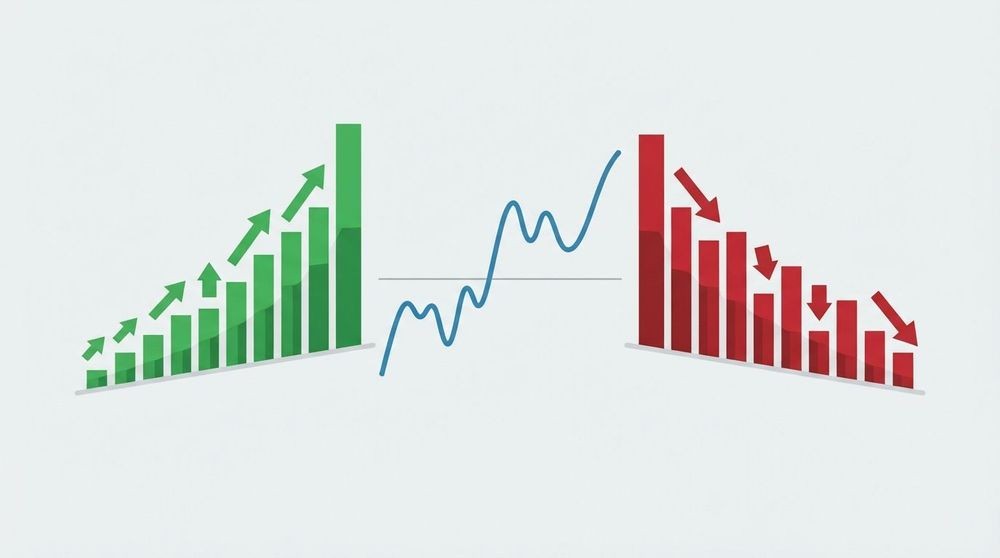
Market breadth indicators measure how many stocks are actually participating in a market move, not just whether the index is up or down. When the S&P 500 climbs but only a handful of mega-cap names are pulling it higher, breadth tells you the rally is hollow. When hundreds of stocks rise together, breadth confirms the move is real. That distinction shapes every risk decision a trader makes.
Here are the five indicators to check every session:
- Advance/Decline ratio: Count advancing stocks minus declining stocks. A positive reading confirms broad participation; a negative reading on an up-index day is your first warning sign.
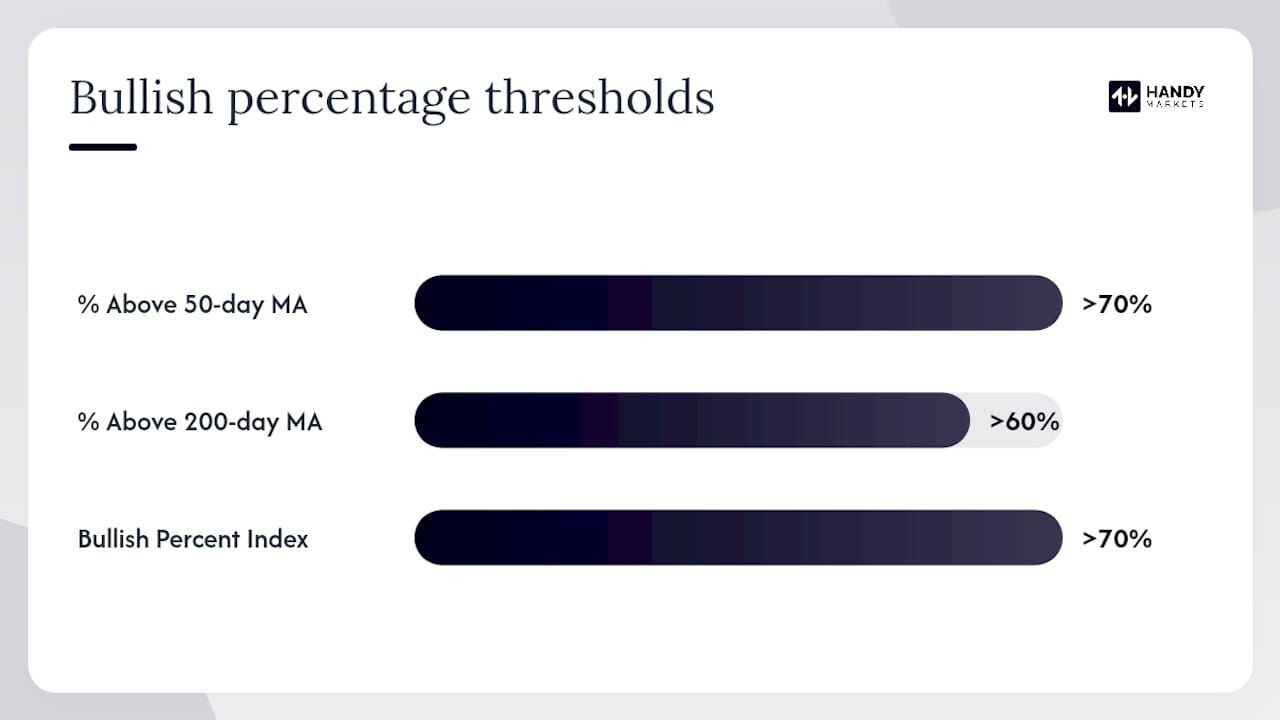
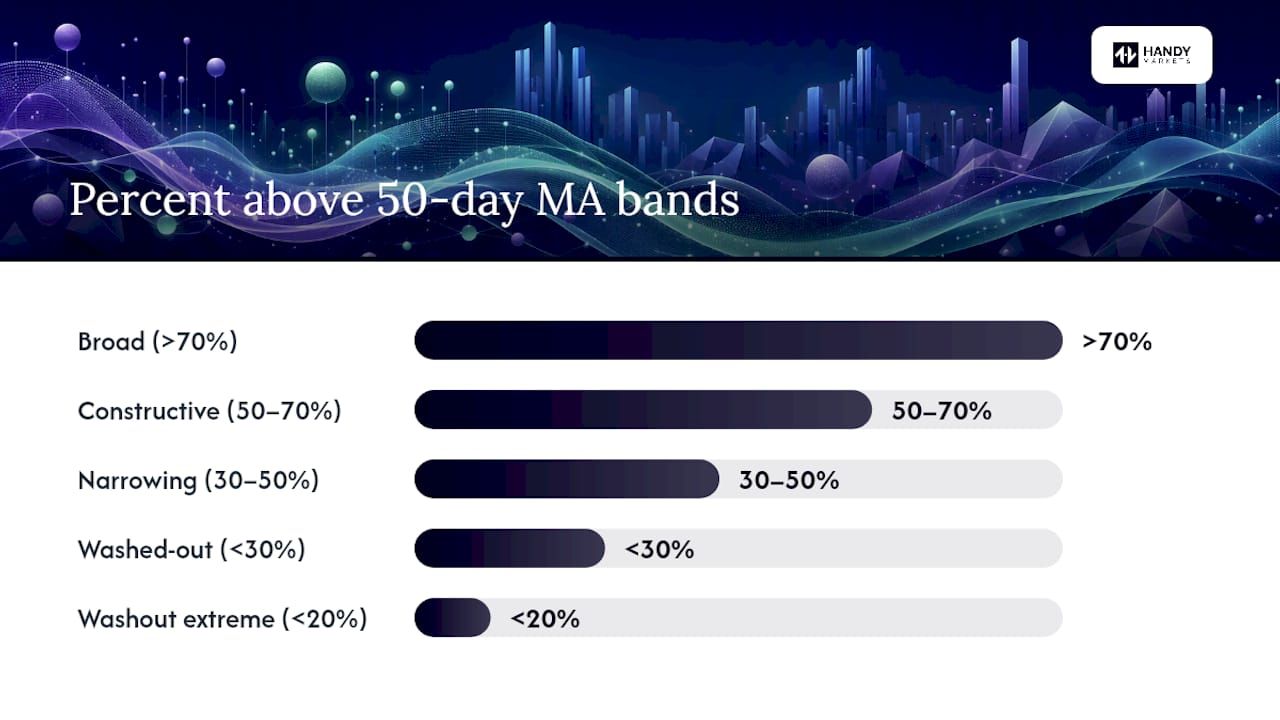
- Percent above 50-day MA: Readings above 70% signal broad participation; readings below 30% mark washout territory where durable lows often form.
- McClellan Oscillator: Positive and rising confirms breadth momentum; negative and falling warns of deteriorating internals even when price holds.
- New Highs vs. New Lows: Expanding new highs alongside an index rally confirms leadership; shrinking new highs on a new index high is a classic divergence.
- TRIN (Arms Index): Readings below 1.0 favor bulls; above 1.0 favors bears; extreme spikes above 2.0 often mark short-term washout lows worth watching for reversals.
Table of Contents
- What market breadth really measures (and why the index alone can mislead you)
- The primary market breadth indicators: formulas, readings, and what they tell you
- How to interpret breadth signals: confirmation, divergence, and extremes
- Concrete ways traders use breadth in real strategies
- Where US traders can get reliable breadth data and charts
- Step-by-step calculations you can reproduce in a spreadsheet
- Limitations and pitfalls that can distort your breadth readings
- A reproducible backtest example using breadth rules
- Key Takeaways
- How we read breadth at Handy Markets each session
- Handy Markets gives you live breadth monitoring without the complexity
- Further reading and data sources
What market breadth really measures (and why the index alone can mislead you)
Market breadth measures participation: how many individual stocks are advancing versus declining, or what percentage are trading above a chosen moving average. It treats every stock equally, regardless of market cap. That equal-weighted view is what makes it so different from the S&P 500 or Nasdaq Composite, both of which weight by market capitalization.
Think about what that means in practice. Apple, Microsoft, and Nvidia together represent a significant slice of the S&P 500. When those three names surge while 400 other index members drift sideways or lower, the index still prints a gain. Breadth, however, will show a net negative or flat reading, revealing the move for what it is: a narrow, concentrated rally driven by a few giants rather than a healthy, broad advance.
Breadth gives you a democratic view of what the average stock is doing — and that view often diverges from the cap-weighted headline number at precisely the moments that matter most. A broad rally, where a large majority of stocks are advancing and the advance/decline line is making new highs alongside the index, carries a very different risk profile than a narrow one.
Timeframe matters too. Different breadth measures answer different questions:
| Breadth Measure | Best Timeframe | Question It Answers |
|---|---|---|
| % above 10-day MA | Intraday / short-term | Is the market washed out or overbought right now? |
| % above 50-day MA | Swing (days to weeks) | Is the intermediate trend healthy or narrowing? |
| % above 200-day MA | Regime / long-term | Are we in a bull or bear market environment? |
| Advance/Decline Line | All timeframes | Is broad participation confirming or diverging from price? |
| McClellan Oscillator | Short to intermediate | Is breadth momentum accelerating or fading? |
A futures scalper cares most about the 10-day breadth and intraday A/D ratios. A swing trader watches the 50-day. A portfolio manager sizing long exposure watches the 200-day and the cumulative A/D line. Knowing which measure fits your horizon is half the battle.
The primary market breadth indicators: formulas, readings, and what they tell you
Every breadth tool starts from the same raw material: how many stocks went up, how many went down, and by how much. The indicators below build on that foundation in different ways, each answering a slightly different question about market health.
| Indicator | Formula / Calculation | What It Measures | Bullish Reading | Bearish Reading |
|---|---|---|---|---|
| Advance/Decline Ratio | Advancing issues ÷ Declining issues | Daily participation | >1.0 (more advancers) | <1.0 (more decliners) |
| A/D Line (cumulative) | Prior A/D Line + (Advancers − Decliners) | Trend of participation | Rising alongside price | Diverging lower while price rises |
| % Above 50-day MA | (Stocks above 50-day MA ÷ Total eligible) × 100 | Swing-trend breadth | >70% | <30% |
| % Above 200-day MA | (Stocks above 200-day MA ÷ Total eligible) × 100 | Regime breadth | >60% | <40% |
| McClellan Oscillator | EMA(19) of net advances − EMA(39) of net advances | Breadth momentum | Positive and rising | Negative and falling |
| TRIN / Arms Index | (Adv. Issues ÷ Dec. Issues) ÷ (Adv. Volume ÷ Dec. Volume) | Volume-weighted sentiment | <1.0 | >1.0; spikes >2.0 = washout |
| New Highs / New Lows | Count of 52-week highs vs. 52-week lows | Leadership breadth | Expanding new highs | Shrinking highs or expanding lows |
| Bullish Percent Index (BPI) | (Stocks on P&F buy signals ÷ Total stocks) × 100 | Point-and-figure participation | >70% (overbought caution) | <30% (oversold opportunity) |
| Zweig Breadth Thrust | 10-day EMA of (Advancers ÷ Advancers + Decliners) | Thrust / momentum surge | Crosses from <0.40 to >0.615 in 10 days | N/A (absence of signal) |
| Hindenburg Omen | Simultaneous new highs and new lows >2.2% of issues | Internal divergence / instability | N/A | Multiple confirmed prints |
A few notes on each:
The Advance/Decline Line is the workhorse. It accumulates the daily net difference between advancing and declining issues, building a running total that you compare directly against the index. When the index makes a new high but the A/D line does not, you have a divergence. That divergence has preceded several major market tops.
The McClellan Oscillator adds momentum to the picture. It is calculated as the 19-period EMA of net advances minus the 39-period EMA of net advances, producing an oscillator that turns before price at many significant bottoms. Readings below -100 often mark washout conditions; readings above +100 can signal short-term overextension.
The Zweig Breadth Thrust is rare and powerful. When the 10-day EMA of the advance ratio moves from below 0.40 to above 0.615 within ten trading days, it signals a surge in participation that has historically preceded strong multi-month gains. It does not trigger often, which is exactly what makes it worth watching.
The Hindenburg Omen deserves a brief mention without overstating it. It fires when both new 52-week highs and new 52-week lows simultaneously exceed 2.2% of total issues, signaling internal divergence. A single print means little; two or more within a month warrant attention as a warning of elevated instability.
How to interpret breadth signals: confirmation, divergence, and extremes
Reading a breadth indicator in isolation is like reading one sentence from a paragraph. The signal only makes sense in context, and that context comes from comparing breadth to price and from watching how multiple indicators agree or disagree.
Confirmation is the straightforward case. The index makes a new high, the A/D line makes a new high, the percent above the 50-day MA is above 70%, and the McClellan Oscillator is positive. Every layer agrees. That kind of broad participation is what a healthy bull market looks like, and it gives traders more confidence to hold or add exposure.
Divergence is where breadth earns its reputation as an early warning system. A rising index paired with a declining A/D line, falling percent-above-50-day readings, and shrinking new highs is a classic multi-layer divergence. When price makes a new high but breadth fails to confirm, the rally is narrowing, and elevated risk is the appropriate posture. This pattern appeared ahead of several notable market peaks.
Extremes work differently. When the percent above the 50-day MA collapses below 30%, the market has often washed out enough that durable lows become possible. Rough orientation bands: above 70% signals broad participation, 50–70% is constructive, 30–50% is narrowing, and below 30% marks washed-out territory where thrust signals tend to appear. A rapid recovery from those depths, especially one that triggers a Zweig Breadth Thrust, carries a historically strong bullish implication.
- Confirmation: Index new high + A/D line new high + % above 50-day >70% = trust the move, hold or add exposure.
- Divergence: Index new high + declining A/D line + falling % above 50-day = treat the high as narrow, reduce size.
- Washout extreme: % above 50-day <20% + McClellan Oscillator deeply negative = watch for thrust signals and contrarian entries.
- Overbought extreme: % above 10-day MA >85% + TRIN <0.60 = short-term overextension, tighten stops on longs.
Pro Tip: Never act on a single session’s breadth reading. A one-day spike or dip in the McClellan Oscillator or the A/D ratio is noise. Wait for two to three consecutive sessions confirming the signal before adjusting position size or stops. Persistence separates a real shift in market internals from a statistical blip.
The layered approach matters most when signals conflict. Reading breadth in three layers, participation (MA breadth), momentum (McClellan), and divergence (A/D vs. price), and requiring agreement across layers before acting, significantly reduces false signals. One layer flashing red while two are green is a caution flag, not a sell signal.
Concrete ways traders use breadth in real strategies
Breadth is not just a background gauge. Active traders use it to filter entries, size positions, and time exits with more precision than price alone allows.
Confirming breakouts and filtering false ones
When a stock or index breaks to a new high, the first question is whether the broader market is participating. A breakout in the S&P 500 accompanied by a rising A/D line and a percent-above-50-day reading above 65% is far more likely to follow through than one where only a handful of large-caps are driving the move. Conversely, a breakout where the A/D line is flat or declining is a classic setup for a false break. Swing traders who filter entries by requiring broad participation avoid a significant share of failed breakouts.
Timing contrarian entries after washouts
Zweig Breadth Thrust signals and back-to-back 90% up-volume days after a real washout mark potential durable lows. The setup: percent above 50-day MA drops below 20%, selling volume dominates for several sessions, then a sharp reversal produces two consecutive days where advancing volume exceeds 90% of total volume. That sequence has historically marked the early stages of meaningful recoveries. A trader watching for this pattern can enter long with a defined stop below the washout low, with breadth itself providing the signal.
Adjusting position size based on breadth health
When the percent above the 200-day MA is above 60% and the A/D line is trending higher, the regime favors full long exposure. When those readings deteriorate, say the 200-day breadth drops below 45% and the A/D line starts rolling over, reducing gross long exposure by 20–30% is a disciplined response that does not require predicting a top. Breadth gives you a probabilistic framework for sizing rather than a binary in/out decision.
Futures traders: using breadth to fade index moves
For index futures scalpers, intraday A/D ratios and TRIN readings are the most relevant tools. When the S&P 500 futures push to a new intraday high but the NYSE A/D ratio is negative or flat, that divergence is a signal to fade the move rather than chase it. A TRIN reading spiking above 2.0 during a selloff often marks a short-term exhaustion point worth fading on the long side. These are not mechanical rules, but they shift the probability calculus in a measurable way.
For equity swing traders, the stock market indicators that complement breadth most effectively are relative strength, volume, and sector rotation data. Breadth tells you the environment; those tools tell you where to focus within it.
Where US traders can get reliable breadth data and charts
The quality of your breadth analysis depends entirely on the quality of your data. Not all breadth feeds are equal, and the differences matter more than most traders realize.
What to check before trusting a breadth source:
- Universe coverage: Does the feed cover NYSE-listed stocks, Nasdaq-listed stocks, or both? The NYSE A/D line and the Nasdaq A/D line behave differently, and conflating them distorts the signal. Know which universe you are reading.
- Intraday vs. end-of-day updates: Swing traders can work with end-of-day data. Futures traders and intraday scalpers need feeds that update throughout the session, ideally every 15–30 minutes.
- Moving average denominators: How does the provider handle new listings? A stock that IPO’d three months ago does not have a 200-day moving average. Providers that include those stocks in the denominator without sufficient history will understate the percent-above-200-day reading. Excluding symbols without sufficient history for the MA is standard practice among specialist breadth providers and something to verify before relying on a source.
- Historical depth: For backtesting breadth rules, you need at least 10–15 years of history to capture multiple market cycles. A provider with only two or three years of data cannot tell you how a signal performed across different regimes.
- Data timing: End-of-day breadth data should reflect the official closing counts from the exchange, not preliminary figures. Intraday data should carry a clear timestamp so you know exactly when the reading was captured.
Specialist breadth sites provide intraday updates, percent-above-MA series, advance/decline ratios, and long historical backfills for strategy testing. Exchange feeds (NYSE, Nasdaq) publish official daily advance/decline counts that serve as the authoritative raw input. Charting platforms vary widely in how they calculate and display breadth series, so always verify the methodology.
Handy Markets is the recommended integrated option for traders who want real-time breadth monitoring alongside price alerts. The platform aggregates live stock data across multiple asset classes, lets you set custom alerts via Telegram, Discord, Slack, SMS, Webhook, or Email, and keeps everything in one personalized dashboard. For traders who want to track live stock quotes and breadth-related price moves without toggling between multiple tools, that consolidation saves meaningful time each session.
Five-minute vetting checklist for any breadth data source:
- Confirm the universe (NYSE only, Nasdaq only, or combined)
- Check the update frequency (intraday or end-of-day)
- Ask how new listings are handled in MA calculations
- Verify historical depth (minimum 10 years for regime analysis)
- Cross-check one day’s advance/decline count against the exchange’s official published figure
Step-by-step calculations you can reproduce in a spreadsheet
Understanding the math behind breadth indicators removes the black-box feeling and lets you verify any data source you use. Here is how to build the core measures from scratch.
Advance/Decline count and cumulative A/D line
For any session, count the number of stocks that closed higher than the prior day (advancers) and the number that closed lower (decliners). Stocks that closed unchanged are excluded.
Net Advances = Advancers − Decliners
A/D Line (today) = A/D Line (yesterday) + Net Advances
The A/D line is simply a running total. Start it at zero on your first data day and add each session’s net advances. Plot it alongside the index to spot divergences visually.
Percent above a moving average
For each stock in your universe, calculate its X-day simple moving average. Flag the stock as “1” if today’s close is above that average, “0” if it is not. Exclude any stock with fewer than X days of price history.
% Above X-day MA = (Sum of “1” flags ÷ Total eligible stocks) × 100
McClellan Oscillator
The McClellan Oscillator uses exponential moving averages of net advances rather than raw counts.
McClellan Oscillator = EMA(19) of Net Advances − EMA(39) of Net Advances
The EMA multiplier for a 19-period EMA is 2 ÷ (19 + 1) = 0.10. For a 39-period EMA, it is 2 ÷ (39 + 1) = 0.05.
Worked example: five-stock sample
| Symbol | Close | 5-day MA | Above MA? | Adv/Dec |
|---|---|---|---|---|
| A | — | — | Yes (1) | Adv |
| B | — | — | No (0) | Dec |
| C | — | — | Yes (1) | Adv |
| D | — | — | No (0) | Dec |
| E | — | — | Yes (1) | Adv |
- Net Advances: 3 advancers − 2 decliners = +1
- % Above 5-day MA: (3 ÷ 5) × 100 = 60%
- A/D Line update: Prior A/D Line value + 1
If yesterday’s A/D Line was 45, today’s becomes 46. Scale this to hundreds or thousands of stocks and you have a meaningful breadth series.
Spreadsheet tips:
- Use a separate column for the “eligible” flag so new listings are automatically excluded from the denominator.
- Lock the starting date of each MA calculation to the stock’s first available close, not the universe start date.
- Plot the A/D line on a secondary axis against the index to make divergences visible at a glance.
- Save a “raw net advances” column separately so you can recalculate EMAs if you change the lookback period.
Limitations and pitfalls that can distort your breadth readings
Breadth indicators are powerful, but they carry real blind spots. Knowing where they can mislead you is as important as knowing how to read them.
Common pitfalls to watch for:
- Mega-cap bias in cap-weighted comparisons: When you compare a breadth reading to the S&P 500, remember the index is cap-weighted. Passive funds allocate by market cap, so large-cap inflows can keep the index elevated even as breadth weakens. The index and breadth can diverge for weeks before price catches up to the internal weakness.
- Universe size and new listings: A universe that includes hundreds of thinly traded micro-caps or very recent IPOs will produce noisier breadth readings than one limited to established, liquid names. Know what is in your denominator.
- Intraday timing mismatches: Intraday breadth snapshots taken at different times of day are not directly comparable. The first 30 minutes and last 30 minutes of the session often show extreme readings that normalize by the close.
- Persistent divergences: A divergence between the A/D line and price can last months before resolving. Treating a divergence as an immediate sell signal has caused traders to exit bull markets far too early. Divergences raise risk; they do not set a timer.
- Single-session thrusts that fail: Not every sharp one-day advance in breadth becomes a Zweig Thrust. A single 90% up-volume day without follow-through is less meaningful than two consecutive ones. Zweig Breadth Thrust requires the advance ratio to move from below 0.40 to above 0.615 within ten days, a specific and rare condition.
- Hindenburg Omen false positives: A single Hindenburg Omen print has a poor track record as a standalone signal. Multiple confirmed prints within a short window carry more weight, but even then, the signal has produced many false alarms.
- Passive flow masking: Compare cap-weighted index returns with equal-weighted index breadth and sector-level breadth heatmaps to spot situations where passive flows are masking genuine internal deterioration.
Best practices checklist:
- Always read breadth in layers: participation first, then momentum, then divergence.
- Require multi-session confirmation (two to three days) before acting on any single breadth signal.
- Cross-check breadth against volume: a broad advance on light volume is less convincing than one on heavy volume.
- Never use breadth as a standalone timing tool. It is a filter and a risk gauge, not a precise entry signal.
- Revisit your universe definition quarterly. Changes in index composition affect breadth readings.
A reproducible backtest example using breadth rules
To illustrate how breadth rules translate into a testable strategy, consider a simple regime filter applied to the S&P 500 universe over a multi-year period.
Methodology:
- Universe: S&P 500 constituents with at least 200 days of price history (survivorship bias acknowledged; this is an illustrative framework, not a live-traded result).
- Indicator and rule: Hold long exposure when the percent of S&P 500 stocks above their 50-day MA exceeds 60% AND the cumulative NYSE A/D line is in an uptrend (above its own 20-day MA). Reduce to 50% long exposure when either condition fails. Exit to cash when both fail.
- Timeframe: The rule is evaluated at the end of each trading day using end-of-day data.
- Out-of-sample consideration: Any strategy tested on historical data should be validated on a period not used in its design. This example is illustrative; traders replicating it should reserve at least one full market cycle as an out-of-sample test.
Methodology note: Missing data for new listings was handled by excluding symbols without a full 50-day price history from both the numerator and denominator. Corporate actions (splits, mergers) were adjusted using split-adjusted close prices. No look-ahead bias was introduced; each day’s signal used only data available at that day’s close.
The practical takeaway from this type of framework is not a specific return figure, which would require proprietary data to verify, but the structural insight: breadth-based regime filters tend to reduce drawdowns during deteriorating markets while maintaining meaningful participation during healthy ones. The filter works because it responds to what the average stock is doing, not just the index heavyweights.
To replicate this on Handy Markets, pull the daily percent-above-50-day series for your chosen universe, export the A/D line data, and apply the two conditions in a spreadsheet. The market trends and strategy context available on the platform can help you frame current readings against historical regimes.
This example is illustrative and does not constitute investment advice. Past patterns in breadth data do not guarantee future results. Always confirm current market conditions with a qualified financial professional before making position changes.
Key Takeaways
Market breadth indicators are most reliable when multiple layers, participation, momentum, and divergence, agree on the same signal across at least two to three consecutive sessions.
| Point | Details |
|---|---|
| Breadth confirms or questions price | A rising index with a declining A/D line signals narrow leadership; reduce exposure until breadth confirms. |
| Use three breadth layers | Check participation (% above MA), momentum (McClellan Oscillator), and divergence (A/D vs. price) together. |
| Extremes mark opportunity | Percent above 50-day MA below 30% marks washout territory; watch for Zweig Thrust signals as potential durable lows. |
| Multi-session confirmation matters | Wait two to three consecutive sessions before acting on any single breadth reading to filter out noise. |
| Handy Markets for live monitoring | Use Handy Markets to track real-time breadth data, set multi-channel alerts, and catch divergences before they resolve. |
How we read breadth at Handy Markets each session
At Handy Markets, the daily monitoring routine starts with the percent above the 50-day MA for the S&P 500 universe. That single number sets the tone: above 70% and we are in a constructive environment; below 30% and we treat every long signal with added skepticism. From there, we check the McClellan Oscillator for momentum direction and the cumulative A/D line for trend confirmation.
For shorter-horizon signals, the 10-day MA breadth reading tells us whether the market is washed out or overextended on a day-to-day basis. When that reading drops below 20%, we flag it as a potential setup for a contrarian bounce. When it spikes above 85%, we tighten stops on existing longs rather than adding new ones.
The platform’s multi-channel alert system means we never miss a threshold crossing. When the percent above the 50-day MA drops below a set level, an alert fires to Telegram or Slack before the session closes, giving us time to act on the signal rather than discover it after the fact. Traders with different time horizons can adapt this routine easily: futures traders weight the intraday A/D ratio and TRIN more heavily, while longer-term investors focus on the 200-day breadth and the A/D line trend.
Handy Markets gives you live breadth monitoring without the complexity
Most traders know they should be watching breadth. The gap is in execution: pulling data from multiple sources, building spreadsheets, and manually checking thresholds every session is time-consuming enough that it simply does not happen consistently.
Handy Markets closes that gap. The platform delivers real-time market data across stocks, ETFs, indices, and more, all in one personalized dashboard you configure once. Set a breadth-related price alert on any asset, and it fires through your preferred channel, whether that is Telegram, Discord, Slack, SMS, Webhook, or Email, the moment the threshold is crossed. No more end-of-day surprises when a divergence has already played out.
Key features for breadth-focused traders:
- Live stock quotes and percent-change data across the full US equity universe
- Customizable alerts tied to price levels that proxy breadth thresholds
- Multi-channel delivery so alerts reach you wherever you work
- Cross-asset monitoring that lets you compare equity breadth signals against commodity and index moves in the same view
The practical payoff is simple: fewer missed signals, more consistent monitoring, and a setup that takes minutes rather than hours to maintain. Start monitoring the markets that matter to you and set your first breadth alert at Handy Markets today.
Further reading and data sources
These are the sources used in building this guide, along with a note on what each offers traders who want to go deeper.
- Breadth of market, Wikipedia: Clean foundational definition of advance/decline methodology and the historical context of breadth analysis. Good starting point for understanding the mechanics.
- Market Breadth: % of Stocks Above the 10, 50, 100 & 200-Day Moving Averages, thetrading.tools: Live percent-above-MA series across multiple horizons with historical charts. Useful for checking current readings and understanding how the 10/50/100/200-day gauges behave differently.
- The Market Breadth Guide: How to Read the Market’s Internals, thetrading.tools: Detailed methodology guide covering McClellan Oscillator, thrust signals, and the layered reading framework. One of the more thorough free resources available.
- What Is Market Breadth? A Key Indicator for Futures Traders, NinjaTrader: Futures-specific framing of breadth analysis, including how index futures traders use A/D divergences and TRIN for intraday decisions.
- Real Market Breadth and Trend Charts, breadth.app: Specialist breadth data site offering intraday updates, advance/decline ratios, and historical backfill. Useful for traders who need raw data exports for spreadsheet replication.
- Market Breadth, CondorEdge: Covers the passive flow masking problem and equal-weighted vs. cap-weighted breadth comparison. Worth reading alongside any analysis of current S&P 500 breadth.
- Handy Markets, live stock quotes and alerts: The recommended platform for real-time breadth monitoring, price alerts, and cross-asset data access in one dashboard.