TL;DR:
- Investor sentiment reflects the collective mood of market participants, driving prices beyond fundamental values.
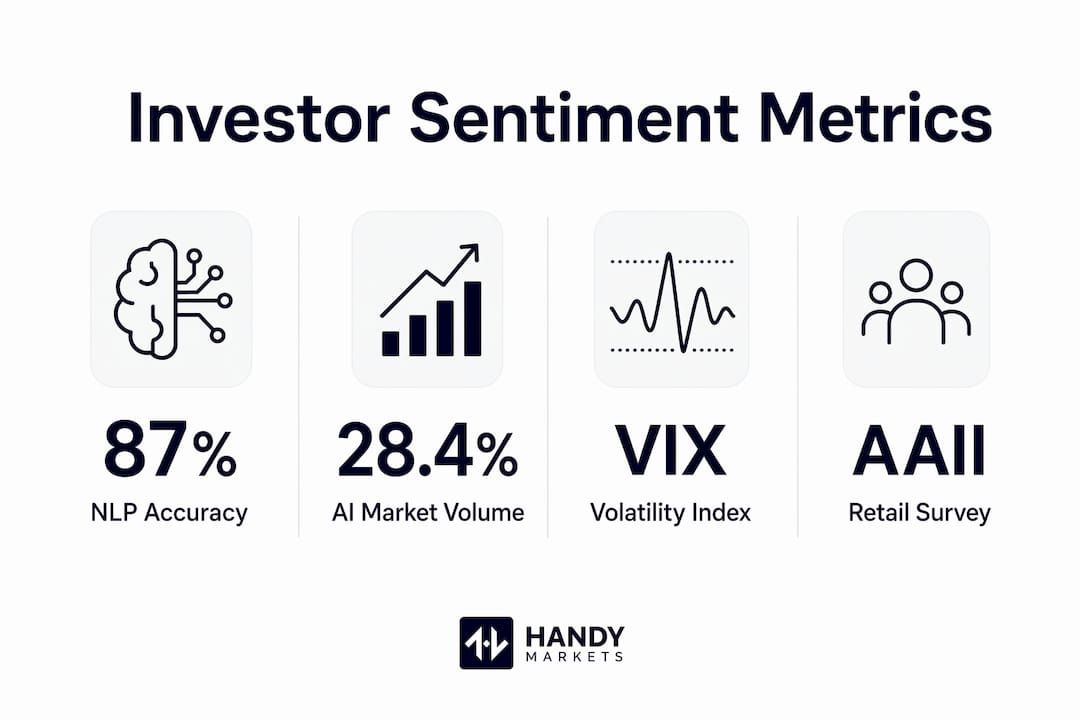
- Measuring it involves combining surveys like AAII, market indicators like VIX, and NLP analysis of financial discourse.
- Extreme bearishness often signals a buying opportunity, while euphoria indicates risk of a correction, making sentiment a valuable contrarian tool.
Investor sentiment is defined as the collective mood, attitude, and emotional state of market participants toward financial assets, sectors, or the broader market at any given moment. It operates as the psychological undercurrent beneath price action, often pushing valuations above or below what fundamentals alone would justify. As of May 30, 2026, bearish sentiment stood at 41.9%, above its historical average for 16 consecutive weeks, while bullish sentiment recovered to 35.6%. That persistent negative spread tells us something fundamental: fear, not data, is currently steering a significant share of market decisions. Understanding investor sentiment gives you a sharper lens for reading those moments when markets behave irrationally, and for positioning yourself accordingly.
How is investor sentiment measured and analyzed in modern markets?
Measuring investor sentiment requires combining qualitative signals with hard quantitative data. No single source tells the full story, and single-source reliance leads to misleading conclusions. The most credible investor sentiment analysis blends surveys, market-derived indicators, and AI-powered text analysis into a composite picture.
The most widely cited survey tool is the AAII Sentiment Survey, published weekly by the American Association of Individual Investors. It measures the percentage of retail investors who identify as bullish, bearish, or neutral over the next six months. Institutional traders watch the bull-bear spread as a contrarian signal, not a directional one.
Beyond surveys, quantitative indicators give a clearer window into actual trading behavior:
- Put/call ratios: A high ratio signals fear and hedging activity; a low ratio reflects complacency.
- ETF flows: Large inflows into defensive ETFs (think bond funds or gold ETFs) indicate risk-off sentiment.
- Retail trading indexes: Tools like Charles Schwab’s STAX track retail investor positioning in real time.
- VIX (CBOE Volatility Index): Often called the “fear gauge,” it measures expected market volatility over 30 days.
Quantitative measures surpass social media chatter by revealing actual trading behavior rather than verbal expressions of opinion. Knowing what investors do with their money is more reliable than knowing what they say they feel.
Natural language processing (NLP) and machine learning have transformed how we process sentiment at scale. Sentiment analysis using NLP can predict market movements with up to 87% accuracy under specific conditions by quantifying investor mood before price changes materialize. These systems scan millions of daily posts, news articles, earnings call transcripts, and financial forums to detect shifts in tone ahead of price action.
| Tool / Source | Data Type | Best Use Case |
|---|---|---|
| AAII Sentiment Survey | Survey (retail) | Contrarian signals at sentiment extremes |
| VIX | Market-derived | Measuring fear and expected volatility |
| Put/call ratio | Options activity | Gauging hedging behavior and risk appetite |
| NLP platforms (e.g., SentiSignal) | Text/AI-derived | Early detection of sentiment shifts in news and social media |
| ETF flows | Fund flow data | Identifying risk-on vs. risk-off positioning |
Pro Tip: When using NLP-based tools, prioritize platforms that filter for future-oriented language. Certain news outlets provide price movement leads of 4 to 10 hours, giving you a meaningful window to act before the broader market reacts.
What impact does investor sentiment have on market behavior?
Investor sentiment does not just reflect market conditions. It actively creates them. When collective optimism peaks, asset prices can detach from intrinsic value, forming bubbles. When fear dominates, prices can fall well below fair value, creating opportunities. The impact of investor sentiment on price trends operates through the lens of behavioral finance, where cognitive biases and emotional reactions override rational calculation.

Consider what happens at sentiment extremes. During the 2021 meme stock frenzy, retail sentiment on Reddit’s WallStreetBets forum drove GameStop’s stock price to levels no fundamental model could justify. The price eventually corrected sharply, but not before sentiment alone sustained an irrational rally for weeks. That episode illustrates a core principle: sentiment can persist longer than logic suggests, especially on the bullish side.
The contrarian application of sentiment data is where the real edge lies:
- Extreme bearishness is a more reliable buy signal than extreme bullishness is a sell signal.
- Panic signals have a 71% hit rate over 20 trading days for identifying buying opportunities.
- Extreme retail optimism without macro support significantly increases the probability of a correction.
- Sentiment-driven momentum can persist for weeks, making timing exits harder than timing entries.
“Investor sentiment serves best as a contrarian indicator during euphoria or despair, signaling possible trend reversals rather than everyday trading moves.” — Charles Schwab
The importance of investor sentiment also shows up in how it shapes risk appetite across the entire market. When sentiment turns positive, investors accept lower risk premiums, bid up equities, and reduce hedging. When it sours, the reverse happens rapidly. Tracking these shifts helps you anticipate where capital is flowing before the price charts confirm it. For context on how sentiment connects to broader stock market trends in 2026, the current bearish overhang suggests a market primed for a sentiment-driven rally if any positive catalyst emerges.
How does investor sentiment differ from fundamental and technical analysis?
Sentiment analysis occupies a distinct lane from the two dominant frameworks most investors already know. Understanding where each method starts and stops helps you use all three together without confusion.
- Fundamental analysis examines a company’s financial statements, earnings growth, debt levels, and competitive position to estimate intrinsic value. It answers the question: “What is this asset actually worth?” It is backward-looking and grounded in reported data.
- Technical analysis studies price charts, volume patterns, moving averages, and momentum indicators to identify trends and potential reversal points. It answers the question: “Where is the price likely to go based on historical patterns?”
- Sentiment analysis captures the current emotional state and forward expectations of market participants. It answers the question: “How do investors feel about this asset right now, and how might that feeling drive near-term price behavior?”
Sentiment captures current expectations and market psychology, not intrinsic or past financial data. This distinction matters because a stock can be fundamentally cheap and technically oversold, yet still fall further if sentiment remains deeply negative. Conversely, a stock with mediocre fundamentals can rally hard if sentiment shifts sharply positive.
The most effective use of sentiment is as a timing and context layer on top of your existing analysis. If your fundamental work identifies an undervalued stock and sentiment data shows extreme bearishness in that sector, you have a higher-conviction entry point. Sentiment alone rarely justifies a position, but it can sharpen when you act on one. Explore advanced market analysis techniques to see how professionals combine these three frameworks in practice.
One real limitation: sentiment is noisy. AI-driven discourse accounts for 28.4% of market volume in April 2026, up from 19% six months prior. That concentration means sentiment in AI-related sectors is heavily influenced by narrative momentum rather than fundamentals, creating distorted readings that require careful interpretation.
What practical steps can investors take to use sentiment in their strategy?
Translating sentiment data into portfolio decisions requires discipline and a clear framework. Here is how we recommend building sentiment into your process:
- Use sentiment extremes as contrarian entry or exit cues. When the AAII bull-bear spread turns deeply negative for multiple consecutive weeks, history suggests a mean reversion rally is more likely than a continued decline. The current 16-week streak of above-average bearishness is exactly that kind of signal.
- Monitor divergence between retail and institutional sentiment. Extreme retail optimism without macro support increases the risk of a sharp correction. When Reddit forums are euphoric but put/call ratios and ETF flows tell a different story, trust the money flows.
- Apply sentiment timing overlays to momentum strategies. Sentiment timing strategies can cut momentum strategy worst drawdowns by 35% with minimal sacrifice in overall returns. This means pausing or reducing momentum exposure when sentiment reaches extreme optimism.
- Watch for sentiment feedback loops. When a sector dominates market discourse, it becomes fragile. Professionals rotate capital from sentiment-saturated sectors to sentiment-poor ones before the reversal hits.
- Aggregate multiple data sources. Combining news sentiment, social media signals, options activity, and ETF flows filters out the noise that any single source carries.
Pro Tip: Sector rotation based on sentiment is one of the most underused strategies among individual investors. When AI-related stocks dominate 28.4% of market discourse, as they do now, that concentration signals a crowded trade. Rotating a portion of exposure toward sentiment-poor sectors like utilities or materials can reduce portfolio risk before the narrative shifts.
Investor behavior analysis works best when you treat sentiment as a weather forecast, not a GPS. It tells you the conditions you are operating in, not the exact route to take. Pair it with your fundamental and technical work, and you have a far more complete picture of the market environment.
Key takeaways
Investor sentiment is the emotional pulse of the market, and reading it accurately separates reactive investors from prepared ones.
| Point | Details |
|---|---|
| Core definition | Investor sentiment is the collective mood of market participants, driving prices beyond what fundamentals justify. |
| Measurement tools | Combine AAII surveys, VIX, put/call ratios, ETF flows, and NLP platforms for reliable sentiment readings. |
| Contrarian power | Extreme bearishness carries a 71% hit rate as a buy signal over 20 trading days, making panic more useful than euphoria. |
| Sentiment vs. other analysis | Sentiment captures current emotions; fundamentals explain value; technical analysis maps price patterns. Use all three together. |
| Practical application | Monitor retail vs. institutional divergence, apply sentiment timing overlays, and rotate away from sentiment-saturated sectors. |
Why sentiment analysis has become non-negotiable in 2026
We have spent considerable time working with market data across multiple asset classes, and one pattern keeps repeating: the investors who get hurt most are not the ones who misread a balance sheet. They are the ones who ignore the emotional temperature of the market entirely.
AI-driven sentiment tools have matured significantly, but they carry a real limitation that most vendors understate. When 28.4% of market volume is driven by AI-related discourse, the sentiment signal in that sector is partially self-referential. The narrative feeds the price, which feeds the narrative. That feedback loop is not a reason to avoid sentiment analysis. It is a reason to use it more carefully, with multiple data sources and a healthy skepticism toward any single reading.
What we have found consistently is that extreme negative sentiment is a stronger and more reliable signal than extreme positive sentiment. Panic is acute and tends to resolve quickly. Euphoria can persist for months. That asymmetry should shape how aggressively you act on each type of signal.
The most important lesson from years of watching sentiment data is this: sentiment does not tell you what the market will do. It tells you what the market is feeling right now, and feelings, under enough pressure, always correct. Build your strategy around that truth, and sentiment becomes one of your most reliable tools.
Track sentiment signals in real time with Handy.Markets
Knowing what investor sentiment means is only half the equation. Acting on it requires live data, and that is exactly what Handy delivers.
Handy.Markets gives you real-time prices, charts, and movement alerts across stocks, crypto, forex, commodities, and indices, all in one place. When sentiment shifts and prices start moving, you will know immediately through alerts delivered via Telegram, Discord, Slack, SMS, or email. Set up your live market alerts in minutes and monitor the assets most sensitive to sentiment swings. Visit Handy’s full markets dashboard to start tracking the data that drives smarter, sentiment-informed decisions today.
FAQ
What is investor sentiment in simple terms?
Investor sentiment is the overall mood or emotional attitude of investors toward a market, sector, or asset at a given time. It reflects whether participants feel optimistic (bullish) or pessimistic (bearish), and it directly influences buying and selling behavior.
What are the most reliable investor sentiment indicators?
The AAII Sentiment Survey, VIX, put/call ratios, and ETF fund flows are the most widely used indicators. Quantitative measures like these reveal actual trading behavior, which is more reliable than verbal sentiment expressed on social media.
How accurate is sentiment analysis for predicting market moves?
NLP-based sentiment analysis can predict market movements with up to 87% accuracy under specific conditions. However, accuracy depends heavily on data quality, source diversity, and filtering for future-oriented rather than reactive content.
Can investor sentiment override strong fundamentals?
Yes, and it does regularly. A fundamentally sound stock can fall sharply if sentiment turns negative, while a weak stock can rally on positive narrative momentum. Sentiment and fundamentals can diverge for weeks or even months before price corrects toward fair value.
How should beginners start using sentiment in their investing?
Start by tracking the weekly AAII Sentiment Survey and the VIX alongside your normal research. When both show extreme readings, treat that as a signal to review your positioning rather than a direct buy or sell trigger. Pair sentiment readings with key stock market indicators for a more grounded view.