TL;DR:
- Effective portfolio monitoring involves systematic tracking of performance and risk through structured reviews, clear metric ownership, and targeted alerts. Regular cadences and AI support help detect issues early, but human judgment remains essential for context and decision-making. Prioritizing high-confidence signals and maintaining attribution for KPIs ensures reliable oversight and informed investment choices.
The portfolio monitoring process is the ongoing, systematic tracking and assessment of your investment portfolio’s performance and risk to inform timely decisions. Known in institutional finance as portfolio surveillance or investment oversight, this discipline covers everything from daily price checks to quarterly deep dives on fund-level metrics like Net IRR and TVPI. A well-built monitoring workflow catches problems early, reduces reactive decisions, and gives you a clear picture of where your capital is working and where it is not. Whether you manage a VC fund, a personal stock portfolio, or a multi-asset allocation, the same core principles apply.
What does an effective portfolio monitoring process require?
Before you run a single report, you need clean data, agreed metrics, and the right tools in place. Skipping this foundation is the single most common reason monitoring workflows break down within months.
Data ingestion is the first obstacle. A data audit typically reveals that 30–40% of portfolio data requires manual processing. That means spreadsheets, email attachments, and PDF reports that no automated system can read without human intervention. The practical fix is a “no rip-and-replace” approach: connect to portfolio companies’ existing systems where possible, and use AI ingestion layers or structured surveys to capture what direct integrations cannot reach.
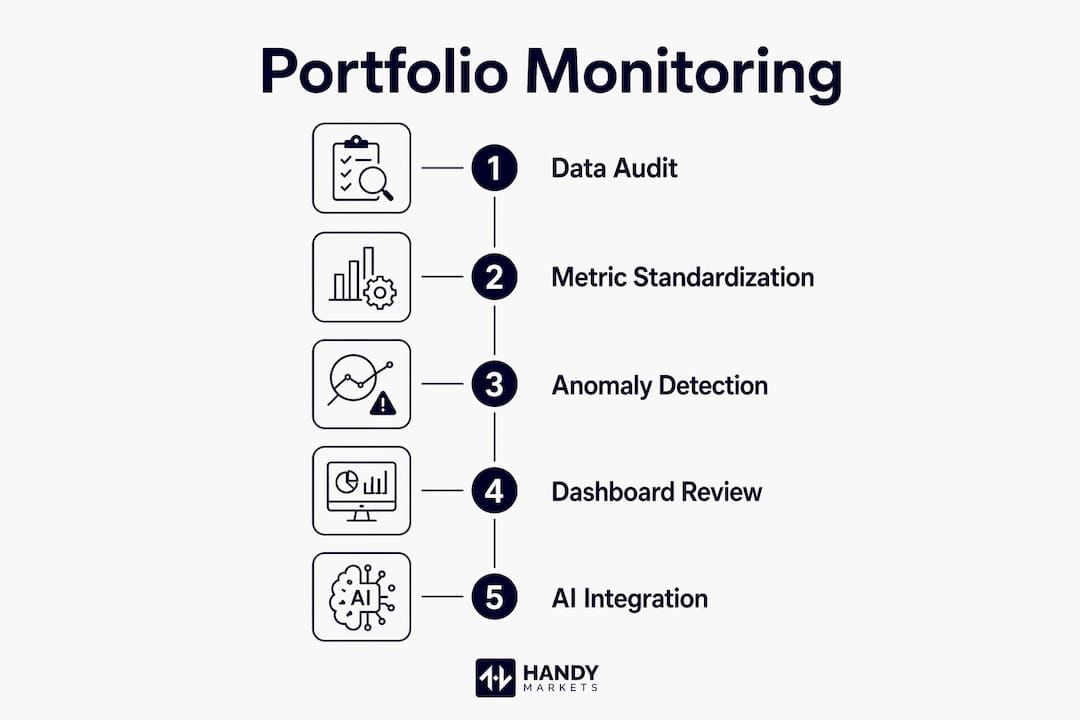
Metric standardization is equally critical. A metric dictionary detailing each KPI’s calculation methodology prevents data aggregation errors when you compare companies across your portfolio. Without it, one company’s “revenue” might include deferred income while another’s does not, making comparisons meaningless.
The right tool setup rarely means one platform. Two-tool setups are common, pairing a real-time alert system with a tax-aware or LP reporting platform. Feature categories to evaluate include data ingestion, anomaly detection, dashboard reporting, and audit trail generation.
| Feature category | What to look for |
|---|---|
| Data ingestion | API integrations, CSV import, AI parsing |
| Anomaly detection | Threshold-based triggers, contextual variance |
| Reporting | LP-ready templates, audit trails |
| Alerting | Multi-channel delivery (email, Slack, SMS) |
- Assign clear ownership for each metric to prevent reporting gaps.
- Use common input templates across all portfolio companies.
- Separate raw data from generated insights to allow fast verification.
Pro Tip: Build your metric dictionary before you select any software. The tool should serve your definitions, not force you to redefine your KPIs around its defaults.
How do you execute a portfolio monitoring workflow step by step?
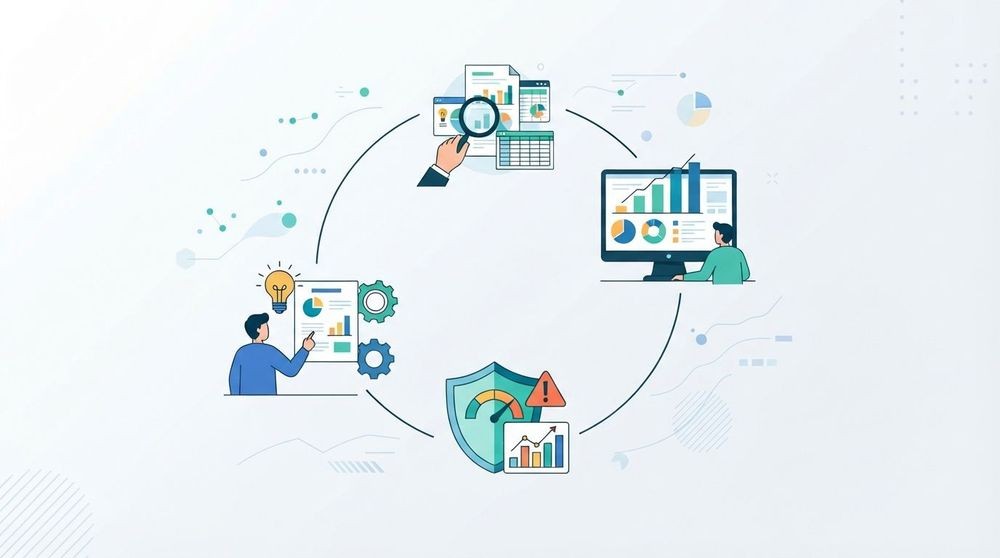
A structured cadence prevents both missed signals and wasted time. Effective monitoring follows three review tiers: monthly quick scans of 15–30 minutes, quarterly deep dives of 2–4 hours, and an annual half-day comprehensive review. Each tier has a distinct purpose.
- Monthly scan (15–30 minutes). Pull key operational metrics: burn rate, cash on hand, headcount, and revenue run rate. Flag any metric that has moved outside its normal range. This is a triage step, not an analysis session.
- Quarterly deep dive (2–4 hours). Review fund-level performance metrics including TVPI, DPI, and MOIC. Compare each company against its prior-quarter baseline and sector benchmarks. Conduct at least one founder conversation per company to capture qualitative signals that numbers miss.
- Annual comprehensive review (half day). Reassess your entire portfolio risk exposure, including concentration, allocation drift, and correlation across holdings. Update your metric dictionary and monitoring thresholds based on what the year revealed.
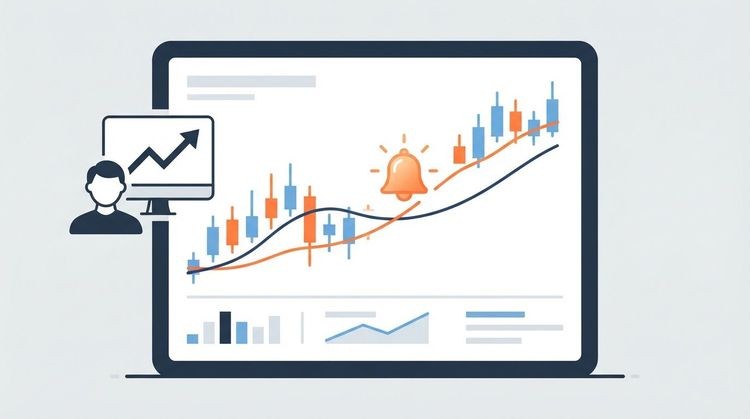
Anomaly detection is the engine that makes monthly scans fast. Clear operational thresholds trigger alerts automatically. Effective triggers include burn rate increases above 30% quarter over quarter, runway falling below six months, and headcount declining more than 15% in a single quarter. Each trigger should link directly to a source document so any analyst can verify the data without re-pulling reports.
A color-coded portfolio health dashboard makes triage visual. Green means on track, yellow means watch closely, and red means immediate action required. This structure lets a small team manage a large portfolio without losing signal in a wall of numbers.

AI-powered monitoring adds a layer that scheduled reviews cannot match. Continuous AI monitoring detects EBITDA deterioration, covenant breaches, and customer concentration shifts weeks before traditional quarterly reporting surfaces them. The key is pairing that automation with human judgment. An AI flag is a prompt to investigate, not a decision.
Pro Tip: Integrate qualitative assessments, such as founder sentiment or competitive dynamics notes, directly into your dashboard alongside quantitative metrics. A company can look healthy on paper while its founding team is quietly falling apart.
What challenges should you expect in portfolio monitoring?
The most common failure mode is ad hoc monitoring. Teams pull data when something feels wrong rather than on a fixed schedule. Scheduled reviews paired with automated alerts form a complete system that prevents both missed issues and overreaction to routine noise. Without the schedule, alerts become the only signal, and that creates anxiety rather than clarity.
Alert fatigue is the second major problem. When every metric triggers a notification, analysts start ignoring all of them. A small number of high-confidence triggers outperforms a long list of low-confidence ones. Set thresholds that reflect genuine risk, not statistical noise.
Attribution and auditability are non-negotiable in LP reporting. Every KPI must trace back to a source document with partner sign-off. Without that chain, your monitoring data cannot support investment committee decisions or satisfy LP due diligence requests.
Data quality degrades without clear ownership. Consistency in data capture matters more than the sophistication of your intake system. Assign one person or team as the owner of each metric. When ownership is ambiguous, data goes stale.
Balancing performance monitoring against risk monitoring is a discipline in itself. Performance metrics tell you where you are relative to targets. Risk metrics tell you what could go wrong. Focusing only on performance creates blind spots. Focusing only on risk leads to paralysis. The goal is a dashboard that shows both in one view, so you can act on the full picture.
Building accountability in financial workflows is not just a governance best practice. It is what separates monitoring systems that last from ones that quietly get abandoned after the first quarter.
What metrics and techniques drive portfolio analysis?
The highest-value signals in portfolio monitoring often come from operational KPIs, not financial statements. Operational data reveals problems months before an income statement does. That is the core insight that separates sophisticated monitoring from basic reporting.
Financial KPIs at the company level:
- Burn rate: Monthly cash outflow. A 30%+ quarter-over-quarter increase is a red flag.
- Runway: Months of cash remaining at current burn. Below six months requires immediate attention.
- Revenue growth: Month-over-month and year-over-year rates compared to plan.
- Cash on hand: Absolute balance, not just relative to burn.
Fund-level performance metrics give you the LP-ready view. TVPI, DPI, Net IRR, and MOIC each measure a different dimension of fund performance. TVPI (total value to paid-in capital) captures unrealized and realized value together. DPI (distributions to paid-in capital) measures actual cash returned. Net IRR above 25% places a fund in the top quartile. MOIC (multiple on invested capital) gives a simple return multiple that LPs understand immediately.
Risk metrics operate on a different axis entirely. Concentration, allocation drift, volatility, and drawdown are structural risk signals, not performance signals. A portfolio can show strong TVPI while carrying dangerous concentration in a single sector. Monitoring both dimensions prevents that blind spot.
| Metric | Category | Typical threshold |
|---|---|---|
| Burn rate change | Operational | Alert at +30% QoQ |
| Runway | Operational | Alert below 6 months |
| Net IRR | Fund performance | Top quartile above 25% |
| TVPI | Fund performance | Target above 1.5x at mid-life |
| Concentration | Risk | Alert above 20% in one holding |
| Drawdown | Risk | Alert at 15% peak-to-trough |
Qualitative techniques round out the picture. Founder morale assessments, competitive dynamics reviews, and market sentiment analysis each capture signals that no spreadsheet can quantify. Benchmarking your companies against sector peers adds context that raw numbers lack. A 10% revenue decline means something very different in a contracting market than in a growing one. You can learn more about tracking multi-asset portfolios to apply these techniques across different asset classes.
Key Takeaways
A disciplined portfolio monitoring process combines structured review cadences, clear metric ownership, and selective automated alerts to catch problems before they become losses.
| Point | Details |
|---|---|
| Build the foundation first | Create a metric dictionary and assign data ownership before selecting any monitoring tool. |
| Use a three-tier cadence | Monthly scans, quarterly deep dives, and annual reviews each serve a distinct purpose. |
| Set high-confidence alerts only | A small number of precise triggers prevents alert fatigue and keeps your team focused. |
| Monitor risk and performance separately | Concentration, drift, and drawdown require different thresholds than return metrics. |
| Link every KPI to its source | Attribution to source documents is required for LP reporting and investment committee decisions. |
What we have learned from monitoring portfolios in practice
The biggest mistake we see is treating monitoring as a reporting task rather than a decision-making discipline. Teams spend hours building beautiful dashboards and then never connect the data to an actual investment decision. The dashboard is not the outcome. The decision it enables is the outcome.
Automation handles the volume, but human judgment handles the context. An AI system can flag a burn rate spike. Only a person who has spoken with the founder knows whether that spike reflects a deliberate growth push or a loss of financial control. We recommend building at least one qualitative touchpoint into every quarterly review, even when the numbers look clean.
We have also found that less is more when it comes to alerts. Teams that monitor every metric end up reacting to noise. Teams that monitor five to eight high-confidence signals make better decisions with less stress. Refine your thresholds every six months based on what actually predicted problems versus what generated false alarms.
Finally, trust in the data is not automatic. It is built through consistent process, clear ownership, and transparent attribution. When your LP asks where a number came from, you should be able to answer in under two minutes. If you cannot, your monitoring workflow has a gap worth fixing before the next reporting cycle.
Real-time monitoring with Handy Markets
Knowing your metrics is one thing. Seeing them move in real time is another.
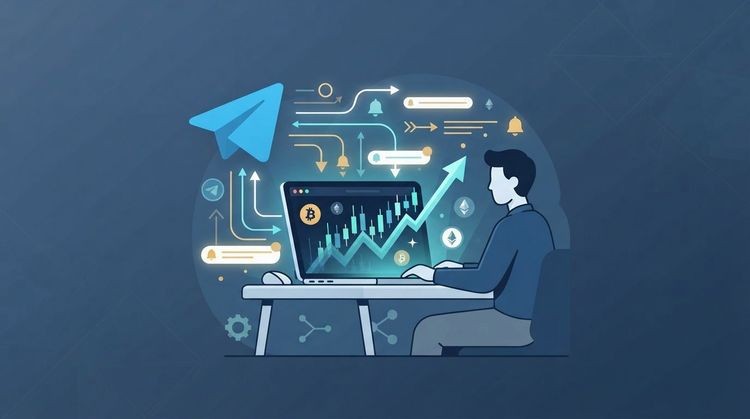
Handy Markets aggregates live prices across cryptocurrencies, stocks, commodities, indices, and forex in a single multi-asset dashboard. You can set price alerts delivered through Telegram, Discord, Slack, SMS, Webhook, or Email, so you never miss a threshold breach while you are away from your screen. Setup takes minutes, and the alert system works across all asset classes without requiring separate tools for each market. For investors who want fast, reliable signals without building a custom monitoring stack, Handy Markets offers a practical starting point. You can also set up price alerts for free and configure your first threshold in under five minutes.
FAQ
What is the portfolio monitoring process?
The portfolio monitoring process is the systematic, ongoing tracking of investment performance and risk metrics to support timely decisions. It includes scheduled reviews, automated alerts, and qualitative assessments across all holdings.
How often should you review your investment portfolio?
An effective cadence includes monthly quick scans of 15–30 minutes, quarterly deep dives of 2–4 hours, and an annual half-day comprehensive review, each serving a distinct analytical purpose.
What metrics matter most in portfolio monitoring?
At the company level, burn rate, runway, and revenue growth are the most predictive operational signals. At the fund level, TVPI, DPI, Net IRR, and MOIC provide the performance picture that LPs expect.
How do you avoid alert fatigue in portfolio monitoring?
Use a small number of high-confidence triggers tied to clear thresholds, such as burn rate rising more than 30% quarter over quarter or runway falling below six months. Low-confidence or excessive alerts cause analysts to ignore all notifications.
What is the difference between performance monitoring and risk monitoring?
Performance monitoring tracks returns relative to benchmarks and targets. Risk monitoring tracks structural factors like concentration, allocation drift, volatility, and drawdown. Both are required for a complete view of portfolio health.