TL;DR:
- Effective asset monitoring requires continuous oversight, account consolidation, and lot-level tax awareness. It is best implemented through automated data feeds, standardized metrics, and a repeatable review schedule. Handy Markets supports this process with real-time alerts, multi-channel notifications, and comprehensive account integration.
Effective asset monitoring comes down to three things: it must be continuous, consolidated across every account you hold, and tax-aware at the lot level. The single most valuable first step is building a unified inventory of all your positions and enabling automated data feeds or CSV imports so your view stays current without manual effort. ISO 55000 frames monitoring as an ongoing discipline woven into the full asset-management lifecycle rather than a quarterly check-in. Handy Markets supports this approach directly, offering real-time feeds, customizable dashboards, and multi-channel alerts across stocks, ETFs, crypto, commodities, forex, and indices.
Table of Contents
- What metrics should you actually monitor?
- How should you structure your monitoring cadence?
- Why lot-level cost tracking changes your tax outcomes
- How do you consolidate accounts to see your true exposure?
- What does a practical alert and data-feed setup look like?
- How to set up this workflow in Handy Markets
- What should you do when an alert fires?
- How do you keep your monitoring data secure and accurate?
- Ready-to-use templates and alert threshold examples
- Key Takeaways
- Why monitoring is the investor’s operational backbone
- Handy Markets makes this monitoring workflow practical
- Useful sources and further reading
What metrics should you actually monitor?
Good monitoring starts with knowing exactly which numbers to watch. Per-asset metrics form the foundation: position quantity, current price, cost basis per lot, unrealized and realized P&L, dividend or distribution details, the FX rate at each transaction date, and all fees and commissions. For multi-currency portfolios, using today’s FX rate retroactively blends currency movement into historical returns and distorts performance attribution.
At the portfolio level, the metrics that drive decisions are:
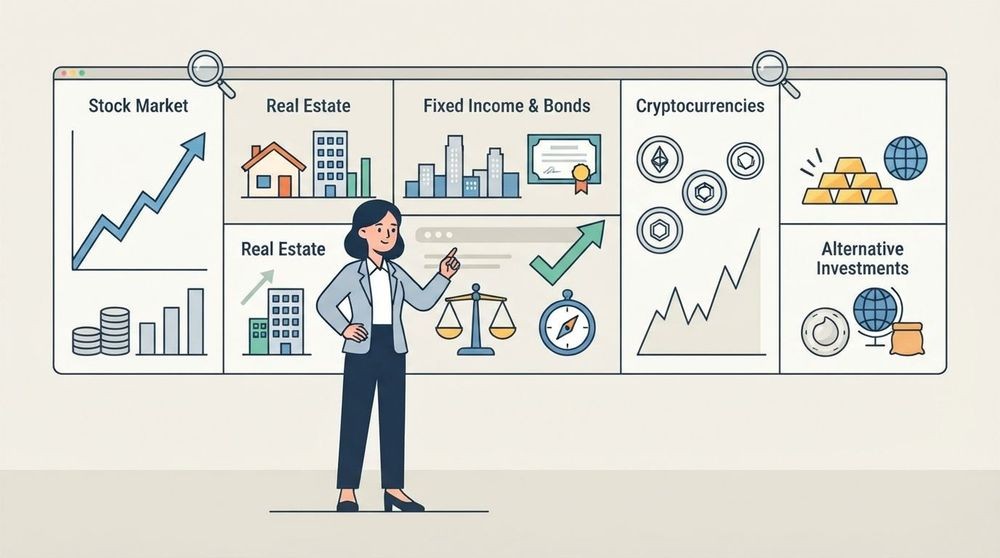
- Asset allocation by class (equities, fixed income, alternatives, cash)
- Sector and geographic exposure as a percentage of total portfolio value
- Single-position concentration (any holding exceeding 10% of the portfolio warrants a flag)
- Volatility measured by standard deviation or beta relative to a benchmark
- Maximum drawdown from the most recent peak
- Rebalancing drift against your target allocation bands
Each metric serves a specific purpose. Drawdown tells you how much pain you are absorbing in real time. Concentration reveals hidden risk that headline net worth figures mask entirely.
How should you structure your monitoring cadence?
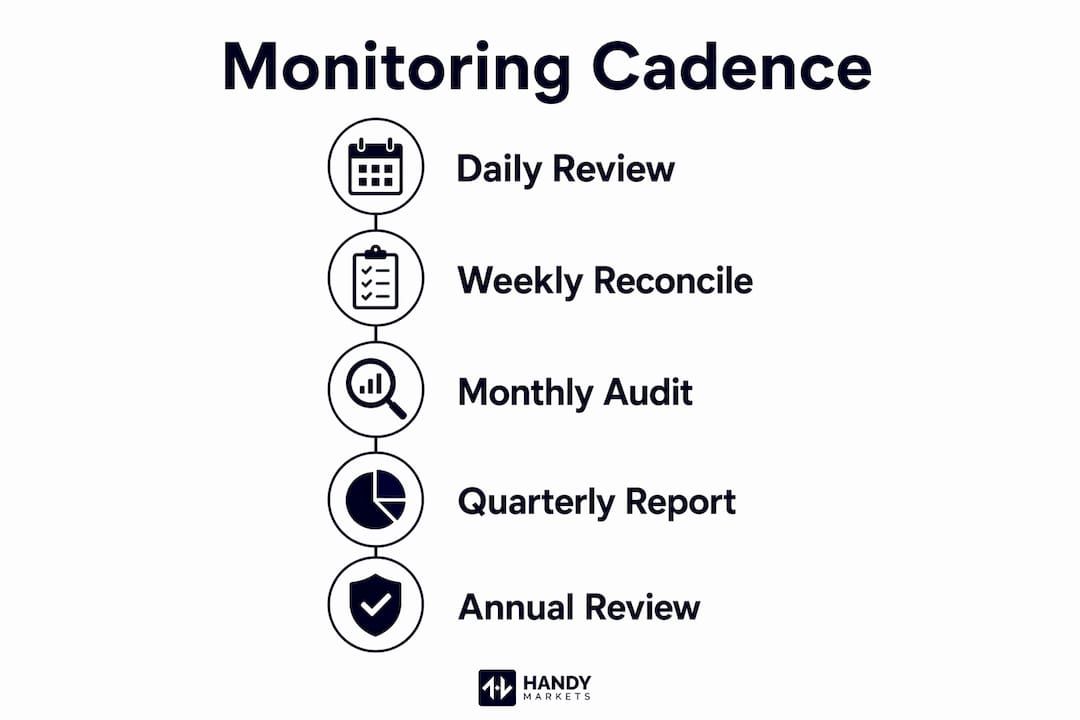
Adopt a repeatable schedule and treat it as operational work, not optional analysis. ISO 55000 principles require that monitoring be governed, measured, and continuously improved as part of the asset-management lifecycle.
| Activity | Frequency | Duration | Owner |
|---|---|---|---|
| Price and alert review | Daily | 5 minutes | Self or automated |
| Trade reconciliation | Weekly | 15–20 minutes | Self |
| P&L and cost-basis check | Monthly | 30 minutes | Self or advisor |
| Allocation drift review | Quarterly | 1–2 hours | Self or advisor |
| Tax and fee audit | Annual | Half day | Self + tax professional |
The recommended cadence keeps you accurate without triggering emotional over-trading. Automated alerts handle the daily layer; you handle judgment calls at the weekly and monthly levels.
Pro Tip: Schedule your weekly reconciliation on the same day each week and block it in your calendar like a meeting. Consistency here prevents the data drift that makes quarterly reviews painful.
Why lot-level cost tracking changes your tax outcomes
Track cost basis per lot, not per ticker. The difference is material. Consider two lots of the same stock: Lot A purchased at $40 (100 shares, long-term) and Lot B at $70 (100 shares, short-term). If the stock trades at $65 and you sell 100 shares, selling Lot A generates a $25 long-term gain per share. Selling Lot B generates a $5 short-term loss per share. Under FIFO, you sell Lot A by default and owe long-term capital gains tax on $2,500. Under specific identification, you sell Lot B and harvest a $500 short-term loss instead.
Reconciliation checklist for lot-level tracking:
- Import every trade with its exact date, quantity, price, and commission.
- Confirm each lot’s acquisition date and holding period (short-term vs. long-term).
- Validate cost basis against broker 1099-B statements annually.
- Flag any wash-sale events (selling at a loss and repurchasing the same or substantially identical security within 30 days).
- Reconcile realized gains and losses monthly against your tax estimate.
Pro Tip: U.S. investors should confirm their broker’s default cost-basis method (FIFO, average cost, or specific identification) before the first sale. Changing the method after the fact is often impossible for already-settled trades.
Granular expense tracking practices used in business accounting apply directly here: record every cost at the transaction level, not the account level.
How do you consolidate accounts to see your true exposure?
Holding assets across multiple accounts does not guarantee diversification. Combined exposure across all accounts is what matters, and a sum-of-parts view often reveals concentration that no single account shows in isolation.
Follow these aggregation steps:
- Inventory every account: brokerage, IRA, 401(k), HSA, and any crypto wallets or alternative platforms.
- Normalize identifiers: map each holding to a common ticker or ISIN so the same security held in two accounts appears as one position.
- Standardize currencies: convert all positions to a single base currency using historical FX rates at each transaction date.
- Import full trade histories: not just current balances, to preserve lot-level cost data.
- Audit for double-counting: cash held in a money-market fund inside a brokerage account should not appear twice.

Common pitfalls include failing to map share classes (Class A vs. Class C of the same fund count as one exposure), ignoring derivatives that create synthetic long or short positions, and overlooking employer stock in a 401(k) that already concentrates equity exposure. A smart diversification review often surfaces these hidden overlaps.
What does a practical alert and data-feed setup look like?
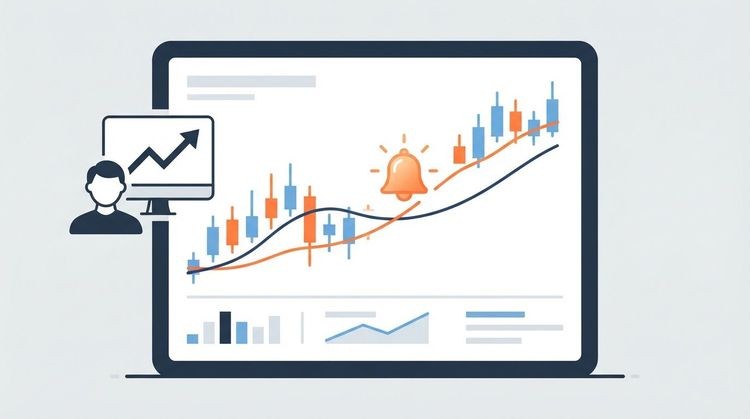
Use a combination of automated broker API feeds and vetted CSV imports. APIs deliver real-time updates; CSV imports cover accounts or assets that lack API connectivity. Continuous monitoring with automated alerts reduces reaction time and supports predictive responses rather than reactive ones.
Alert channel mapping:
| Alert Type | Recommended Channel | Escalation Rule |
|---|---|---|
| Price breakout (±5%) | Telegram or SMS | Confirm with second data source before acting |
| Allocation drift (>3% from target) | Review within 24 hours; rebalance if drift exceeds 5% | |
| Volume spike (3× 20-day average) | Webhook to dashboard | Cross-check news feed; log reason |
| Correlation breach | Reassess hedge positions promptly | |
| Dividend or corporate action | Verify ex-date and update cost basis | |
| FX threshold (±2% in base currency) | Telegram | Recalculate multi-currency P&L |
Alert best practices:
- Set cooldown windows (minimum 15 minutes between repeat alerts for the same trigger) to avoid notification fatigue.
- Deduplicate alerts when multiple rules fire on the same asset simultaneously.
- Test webhook payloads in a staging environment before going live.
- Backtest thresholds on 90 days of historical data to calibrate false-positive rates.
Handy Markets supports all six channels above (Telegram, Discord, Slack, SMS, Webhook, and Email) and lets you configure thresholds per asset class from a single dashboard. For real-time data feed options, the platform aggregates live prices across crypto, stocks, ETFs, commodities, forex, and indices.
How to set up this workflow in Handy Markets
You can have consolidated monitoring and live alerts running in Handy Markets in under an hour.
- Create your asset inventory. Log in and add each asset class you hold: stocks, ETFs, crypto, commodities, and forex pairs.
- Import holdings. Use the CSV import for accounts without API access; connect broker APIs where available. Verify that the combined view matches your broker statements.
- Configure lot-level cost basis. Enter each lot’s acquisition date, price, quantity, and commission. Set your preferred cost-basis method (specific identification recommended for U.S. tax optimization).
- Set multi-currency base. Choose USD as your base currency and confirm historical FX rates are applied at each transaction date.
- Define alert rules. Start with two test scenarios:
- Drawdown alert: trigger when any single position drops more than 8% from its 30-day high; route to SMS and Telegram.
- Rebalancing trigger: fire when equity allocation drifts more than 5% above target; route to email with a webhook to your tracking spreadsheet.
- Validate end-to-end. Manually move a test price to confirm the alert fires, the channel receives it, and the log records the event.
Handy Markets covers live stock quotes and alerts as well as ETF monitoring with the same alert infrastructure, so one setup covers your full portfolio.
What should you do when an alert fires?
Follow a short, repeatable playbook every time. Knee-jerk reactions to alerts are one of the most common sources of unnecessary trading costs.
- Validate the signal. Cross-check the price move against a second data source. A stale feed or data error fires alerts too.
- Check portfolio context. What is the current position size? Is this asset correlated with others that also moved?
- Review news. A 5% drop on earnings news is different from a 5% drop on no news. Interpreting real-time data correctly before acting prevents costly mistakes.
- Decide and document. Choose one of four responses: ignore (false positive), monitor (watch for 24 hours), trade (execute with pre-defined size rules), or rebalance (adjust allocation per your target bands).
- Log the outcome. Record the alert time, your decision, the rationale, and the result. This log becomes the raw material for refining your thresholds over time.
If the alert involves a position that represents more than 15% of your portfolio or triggers a potential wash-sale event, pause and consult your advisor before executing.
How do you keep your monitoring data secure and accurate?
Protect credentials, validate feeds, and reconcile regularly. The weakest link in most monitoring setups is human process, not technology.
Security checklist:
- Use API tokens with read-only permissions rather than sharing full account credentials.
- Enable multi-factor authentication (MFA) on every broker account.
- Limit webhook endpoints to known IP ranges and rotate tokens quarterly.
- Audit access logs monthly for unexpected activity.
Data integrity checks:
- Run daily price sanity checks: flag any asset showing a move greater than 20% that has no corresponding news event.
- Reconcile broker statements monthly against your tracker’s realized P&L figures.
- Check for stale FX rates (any rate older than the trading day) before running performance reports.
- Audit for missing corporate actions (stock splits, mergers, spin-offs) that silently distort cost-basis calculations.
Ready-to-use templates and alert threshold examples
Use ready templates for inventory, alert rules, and reconciliation to avoid implementation drift. A quick-start approach prioritizes high-value assets first and establishes standard operating procedures before expanding coverage.
Monitoring checklist fields to capture per position:
- Asset name, ticker/ISIN, exchange
- Account and broker
- Lot acquisition date, quantity, price, commission
- Current price, unrealized P&L, holding period
- Asset class, sector, geography
- Last dividend date and amount
Sample alert thresholds by investor profile:
- Conservative: price move ±3%, allocation drift ±2%, drawdown 5%
- Moderate: price move ±5%, allocation drift ±4%, drawdown 10%
- Aggressive: price move ±8%, allocation drift ±6%, drawdown 15%
Downloadable versions of these templates and deeper implementation guides are available on the Handy Markets blog.
Key Takeaways
Effective asset monitoring requires a continuous, consolidated, and tax-aware process built on lot-level cost tracking, automated alerts, and a repeatable decision playbook.
| Point | Details |
|---|---|
| Monitor continuously | Daily alerts, weekly reconciliations, and quarterly reviews form the minimum viable cadence. |
| Track cost basis per lot | Specific-identification selling requires per-lot data; per-ticker tracking misses tax-loss harvesting opportunities. |
| Consolidate all accounts | True exposure only appears when every account is aggregated into a single normalized view. |
| Use structured alert rules | Set cooldown windows, deduplicate triggers, and backtest thresholds to reduce false positives. |
| Handy Markets implementation | Handy Markets supports consolidated monitoring, lot-level imports, and multi-channel alerts across all major asset classes. |
Three actions to take today:
- Create your consolidated inventory by listing every account and importing holdings via CSV or API.
- Enable lot-level cost tracking and confirm your broker’s default cost-basis method.
- Set one test alert with a webhook or email to validate your end-to-end notification flow.
Why monitoring is the investor’s operational backbone
Most investors treat monitoring as a passive activity, something that happens when they remember to log in. That framing is the root cause of most portfolio surprises. Monitoring is operational work with a defined cadence, clear ownership, and documented outcomes. When you treat it that way, three things become visible that are otherwise invisible: hidden concentration built up across accounts over years, tax-loss harvesting windows that close within days, and execution timing advantages that only appear when you are watching the right metrics in real time.
The portfolio monitoring process is not about watching prices obsessively. It is about building a system that surfaces the right signal at the right moment so your decisions are deliberate, not reactive. The investors who consistently outperform on an after-tax basis are almost always the ones who have formalized this process, not the ones with the best stock picks.
Handy Markets makes this monitoring workflow practical
Real-time monitoring across every asset class you hold, without stitching together five separate tools, is exactly what Handy Markets is built for. The platform aggregates live prices for stocks, ETFs, crypto, commodities, forex, and indices in one place, with customizable dashboards you can configure in minutes.
The alert system covers Telegram, Discord, Slack, SMS, Webhook, and Email, so your notifications reach you on whichever channel you actually check. Thresholds are fully customizable per asset, and the free tier lets you test the full alert workflow before committing to a subscription. Set your first price alert for free today and confirm your end-to-end monitoring flow is working before your next market open.
Useful sources and further reading
- ISO 55000: Asset Management Standards — the international framework for continuous, lifecycle-integrated asset management
- Asset Management Best Practices Guide (EPA) — the five core questions framework for asset inventory and condition assessment
- How to Track Your Investment Portfolio (AllInvestView) — lot-level cost-basis tracking and specific-identification strategies
- Portfolio Tracking: The Complete Guide (FlashFi) — multi-currency performance attribution and review cadence recommendations
- How to Track Multiple Brokerage Accounts (HelmTerminal) — cross-account consolidation and concentration detection
- Complete Guide to Online Asset Monitoring (Tractian) — continuous telemetry, alert design, and escalation paths
- Quick Start Guide to Asset Monitoring (Globalstar) — rollout sequencing and SOP design for new monitoring programs
- Financial Asset Tracking Guide for Investors (Handy Markets) — implementation guide for individual investors using Handy Markets
- The Portfolio Monitoring Process (Handy Markets) — cadence, roles, and process walkthrough for ongoing monitoring