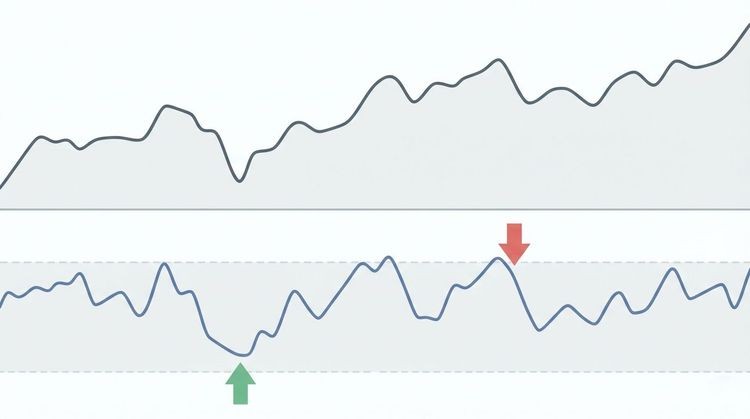
Chart indicators are mathematical calculations plotted directly on a price chart, turning raw price and volume data into visual signals for trend, momentum, volatility, and volume. Traders use them to answer one question in different ways: is this move real, and is it likely to continue?
If you’re starting from zero, build a four-piece starter toolkit rather than chasing every indicator you see on a chart. Pair a trend filter with a momentum oscillator, a volume confirmation tool, and a volatility guard, and you’ve covered the four jobs any indicator stack needs to do.
- Trend filter: A moving average or the Average Directional Index (ADX) tells you whether the market is trending or chopping sideways.
- Momentum oscillator: The Relative Strength Index (RSI) or Stochastic Oscillator shows whether buying or selling pressure is accelerating or fading.
- Volume confirmation: On-Balance Volume (OBV) or the Accumulation/Distribution Line tells you whether real participation backs a price move.
- Volatility guard: Bollinger Bands or the Average True Range (ATR) help you size stops and gauge how much room a trade needs to breathe.
Handy.Markets displays these layers on live charts across stocks, crypto, forex, and commodities, so you can watch a signal form and get notified the moment it does.
| Indicator | Best For | Typical Timeframe | Signal Type |
|---|---|---|---|
| Moving Average / ADX | Trend confirmation | Swing to position | Lagging |
| RSI / Stochastic | Momentum shifts | Intraday to swing | Leading (oscillator) |
| OBV / A/D Line | Volume confirmation | All timeframes | Confirming |
| ATR / Bollinger Bands | Volatility and stop sizing | All timeframes | Lagging |
Key Takeaways
A small, role-based indicator stack, tuned to your asset and timeframe and validated through backtesting, consistently outperforms relying on a single tool.
| Point | Details |
|---|---|
| Build by role, not popularity | Combine a trend filter, momentum trigger, volume confirmation, and volatility guard rather than duplicating one category. |
| Tune defaults to your market | Shorten RSI or MACD periods for scalping and volatile crypto pairs; lengthen them for position trades in large-cap stocks. |
| Confirm before you trust a signal | Check volume or divergence alongside any crossover or threshold break to filter out false signals. |
| Validate with backtesting | Test entry and exit rules across multiple market regimes and track drawdown and expectancy, not just profit. |
| Monitor without staring at screens | Handy.Markets layers live indicator charts with multi-channel alerts across crypto, stocks, forex, and commodities so you catch signals as they happen. |
Table of Contents
- What Are the Main Categories of Chart Indicators?
- The Core Chart Indicators Every Trader Should Know
- How Do You Choose and Combine Indicators?
- How Do You Set Up Chart Indicators for the First Time?
- How Do You Backtest and Manage Risk With Indicators?
- A Worked Example: Turning Signals Into Alerts
- What Experienced Traders Actually Do Differently
- Put Your Indicator Stack to Work With Handy Markets
- Frequently Asked Questions
- Sources
What Are the Main Categories of Chart Indicators?
Every chart indicator falls into one of five buckets, and each bucket answers a different practical question. Sort your tools by what they actually tell you, not by how popular they are on social media.
Trend indicators answer: “Is the market moving in a direction, or is it stuck?” Moving averages, ADX, and trendlines fall here. They’re mostly lagging by design. They confirm a direction after it has already started, which is the tradeoff you accept for fewer false starts.
Momentum indicators answer: “Is the current move gaining or losing steam?” RSI, Stochastic, and MACD live in this category. They tend to lead price at turning points, which is exactly why they’re prone to firing early in a strong trend.
Volume indicators answer: “Does real participation support this price move?” OBV and the Accumulation/Distribution Line track buying and selling pressure independent of price. A price breakout on shrinking volume is a warning sign these tools catch that a pure price chart won’t.

Volatility indicators answer: “How wide should my stop be, and is a big move brewing?” Bollinger Bands and ATR quantify how much a security typically moves, which matters more for risk management than for entry timing.
Price and oscillator patterns cover candlestick formations and chart-pattern reads that sit closer to raw price interpretation than to formula-driven output. Candlestick charts display the open, high, low, and close for each period, making short-term reversals easier to spot visually, and they work best paired with a momentum or volume tool for confirmation.
Here’s the practical mapping traders actually use:
- Trend: Simple Moving Average, Exponential Moving Average, ADX (lagging)
- Momentum: RSI, Stochastic, MACD (leading at turns, lagging in strong trends)
- Volume: OBV, A/D Line (confirming)
- Volatility: Bollinger Bands, ATR (lagging, risk-focused)
- Price patterns: candlestick formations, support and resistance zones (contextual)
No single category tells the whole story. A trend indicator can show a clean uptrend while volume is quietly drying up underneath it, which is precisely the divergence a volume tool is built to catch. Combining categories, rather than stacking three flavors of the same category, is what actually cuts down on false signals.
The Core Chart Indicators Every Trader Should Know
This is the reference section you’ll come back to. Each indicator below includes what it calculates, common default settings, how signals fire, and where it tends to mislead you.
Moving Averages (SMA and EMA)
A Simple Moving Average (SMA) averages closing prices over a set period. An Exponential Moving Average (EMA) weights recent prices more heavily, so it reacts faster to new information. Traders commonly plot a 50-period and 200-period pair, watching for a “golden cross” (short-term average crossing above the long-term one) or a “death cross” (the reverse) as trend-shift signals.
- Best for: trend-following, not mean-reversion.
- Timeframe: works on any timeframe, but the 50/200 combination is typically used for medium- to longer-term trading.
- Signal type: lagging.
- Pros: simple, widely watched, easy to layer on any chart.
- Cons: crossovers arrive late in fast markets, and moving averages whipsaw badly in choppy, range-bound conditions.
MACD (Moving Average Convergence Divergence)
MACD plots two lines, the MACD line and a signal line, plus a histogram showing the gap between them. The standard setup uses 12, 26, and 9-period exponential averages, and a crossover of the MACD line above the signal line is read as bullish momentum building.
- Best for: momentum shifts within an established trend.
- Timeframe: swing trading, though intraday traders shorten the inputs.
- Signal type: leading at turning points, lagging in strong trends.
- Pros: visualizes momentum change clearly through the histogram; good for spotting divergence.
- Cons: generates frequent false crossovers in sideways markets. Read our practical MACD guide for trade rule examples beyond the basic crossover.
RSI (Relative Strength Index)
RSI is a momentum oscillator that oscillates between 0 and 100. Readings above 70 are traditionally labeled overbought and below 30 oversold, with a default period of 14.
Statistic worth remembering: the 70/30 threshold is a convention, not a law. In a strong uptrend, RSI can sit above 70 for weeks while price keeps climbing, so treat “overbought” as a caution flag, not an automatic sell trigger.
- Best for: mean-reversion setups and spotting momentum divergence.
- Timeframe: intraday to swing.
- Signal type: leading.
- Pros: intuitive scale, effective for divergence spotting against price.
- Cons: stays pinned near extremes during strong trends, producing early exit signals that cost you the rest of the move.
Stochastic Oscillator
The Stochastic Oscillator compares a closing price to its price range over a set lookback period, typically 14 periods with a 3-period smoothing. Like RSI, it runs from 0 to 100, with readings above 80 read as overbought and below 20 as oversold.
- Best for: range-bound, mean-reversion trading.
- Timeframe: intraday and short-term swing.
- Signal type: leading, and faster to react than RSI.
- Pros: sensitive to short-term price swings, good for scalping setups.
- Cons: noisy in trending markets, throwing off frequent whipsaws if used alone.
Bollinger Bands
Bollinger Bands plot a moving average with an upper and lower band set at a chosen standard deviation, most commonly a 20-period simple moving average with bands two standard deviations wide. Band contractions (“the squeeze”) often precede sharp moves, while wide bands signal elevated volatility that may be nearing exhaustion.
- Best for: volatility-based mean-reversion and breakout anticipation.
- Timeframe: works across timeframes; the squeeze pattern is watched heavily on daily charts.
- Signal type: lagging on the bands themselves, but the contraction pattern acts as a leading warning.
- Pros: visualizes volatility directly, adapts automatically to changing conditions.
- Cons: a squeeze tells you a move is coming, not which direction. Pairing bands with a trend or momentum reading is what filters out false breakouts.
On-Balance Volume (OBV)
OBV is a running cumulative total that adds a period’s volume on up days and subtracts it on down days. The direction of the OBV line matters more than its absolute value, and divergence between OBV and price can flag a weakening trend before price confirms it.
- Best for: confirming whether a trend has real institutional participation behind it.
- Timeframe: all timeframes, particularly useful on daily charts for swing setups.
- Signal type: confirming, sometimes leading via divergence.
- Pros: simple to read, effective early warning through divergence.
- Cons: doesn’t quantify how much volume matters, only its direction, so it works best alongside price structure.
Accumulation/Distribution (A/D) Line
The A/D Line is another cumulative volume tool, but it weights each period’s volume by where the close falls within that period’s range, giving a more nuanced read than OBV’s simple up/down split.
- Best for: spotting quiet accumulation or distribution before a breakout.
- Timeframe: swing and position trading.
- Signal type: confirming.
- Pros: captures intra-period buying or selling pressure that OBV misses.
- Cons: slower to react, and less intuitive to read at a glance than OBV.
Average Directional Index (ADX)
ADX measures the strength of a trend, regardless of its direction, on a scale from 0 to 100. Readings above 40 indicate a strong trend, while readings below 20 suggest a weak or non-existent trend.
- Best for: deciding whether to apply a trend-following or mean-reversion strategy in the first place.
- Timeframe: swing and position trading.
- Signal type: lagging.
- Pros: filters out choppy conditions before you even place a trade.
- Cons: doesn’t tell you direction, only strength, so it always needs a directional indicator alongside it.
Average True Range (ATR)
ATR calculates the average range a security has moved over a set period, commonly 14, capturing gaps as well as intraday range. It doesn’t predict direction. It measures how much room a trade typically needs.
- Best for: position sizing and stop placement across any strategy.
- Timeframe: all timeframes.
- Signal type: lagging.
- Pros: adapts stop distance to actual market behavior instead of a fixed dollar or percentage figure.
- Cons: a rising ATR after you’ve entered a trade can mean the stop you set is now too tight for current conditions.
Pro Tip: Watch for a MACD bullish crossover that coincides with rising OBV. That combination tells you momentum and participation are both turning up together, which is a stronger signal than either indicator alone. If OBV is flat or falling while MACD crosses up, treat the signal with real skepticism.
Every indicator above carries the same caveat: none of them predict the future. They describe what has already happened in price and volume, some faster than others, and every one of them can be wrong in a regime it wasn’t built for. A trend indicator in a choppy market or a mean-reversion oscillator in a trending market will both mislead you consistently, which is why the next section matters as much as this one.
How Do You Choose and Combine Indicators?
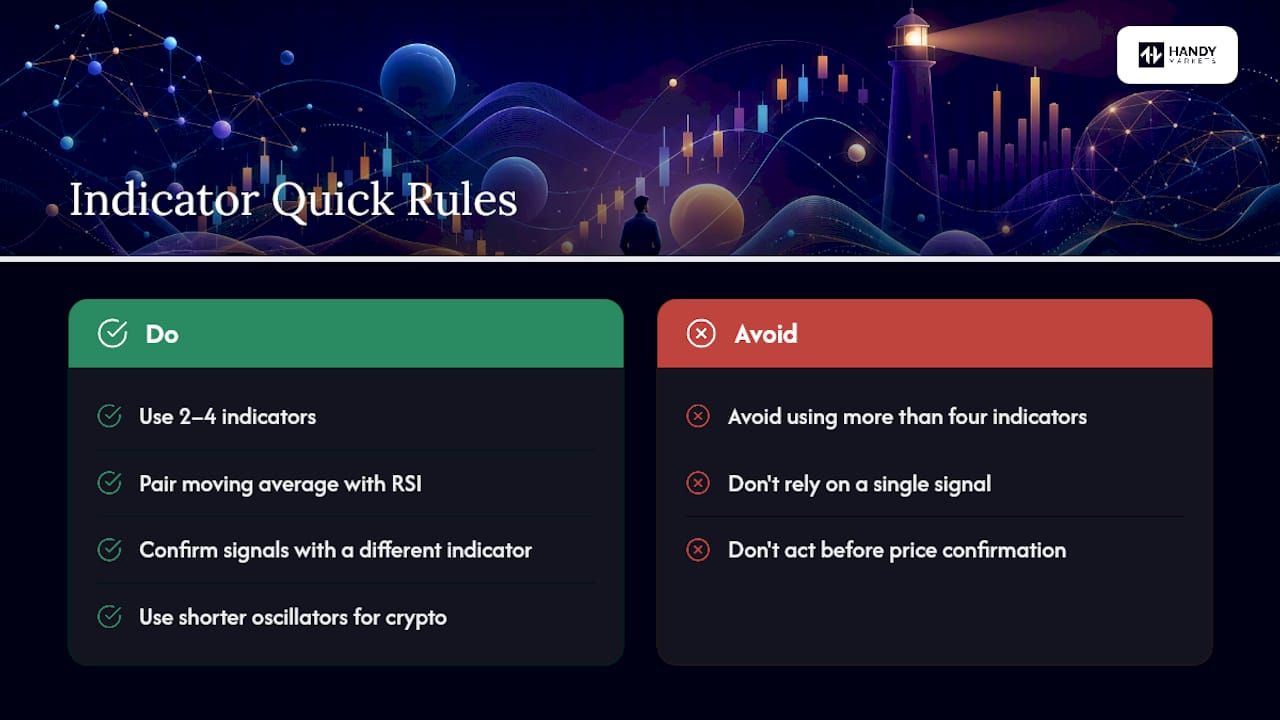
Pick indicators by role, not by popularity. Traders who succeed with technical analysis typically run two to four complementary indicators rather than a single tool, and the “complementary” part is what most beginners get wrong.
- Assign each slot a distinct job. You need a filter (should I even be looking at this trade?), a trigger (when do I enter?), a confirmation (does the trigger check out?), and a risk gauge (how big should my stop be?).
- Match indicators to your trading style. Day traders lean on faster oscillators and shorter moving averages; swing and position traders lean on ADX, longer EMAs, and weekly Bollinger Band reads.
- Test the combination on multiple securities before trusting it. A stack that works beautifully on a trending tech stock can fail entirely on a range-bound currency pair.
Three combinations cover most trading styles:
- Trend continuation: 50 EMA (filter) + MACD (trigger) + OBV (confirmation). Enter when MACD crosses up above a rising 50 EMA, with OBV climbing alongside price.
- Mean-reversion: Bollinger Bands (filter) + RSI or Stochastic (trigger). Enter near the lower band when RSI shows oversold, then exit near the middle band or upper band.
- Breakout: ADX (filter, confirming trend strength above 20 to 25) + a volume indicator (confirmation, checking OBV or A/D is rising alongside the breakout).
Build your stack against this checklist before you commit to it:
- No two indicators measure the same thing (skip running RSI and Stochastic together; they largely duplicate each other).
- Categories are mixed: at least one trend, one momentum or volume, and a risk gauge.
- Signal timing varies, so you’re not waiting on three lagging tools to all confirm at once.
- The number of alerts you’d generate in a normal week is manageable, not a constant stream of noise.
The most common mistake is indicator crowding, piling five or six tools onto one chart until the signals contradict each other and you freeze. A close second is overfitting to textbook defaults. The 14-period RSI or 12/26/9 MACD are starting points, not universal truths, and they should be adjusted to the asset’s actual volatility. The third mistake, and the most expensive one, is trusting an indicator blindly without checking it against price action and volume context.
Pro Tip: If you can’t explain in one sentence why each indicator on your chart is there, you have too many indicators.
How Do You Set Up Chart Indicators for the First Time?
Getting an indicator stack onto a chart correctly is mostly about avoiding clutter and picking sensible starting parameters. Here’s the sequence that works on most charting platforms:
- Choose your chart type. Candlestick charts are the standard choice because they display open, high, low, and close clearly, making short-term reversals easier to spot than on a simple line chart. Point-and-figure charts, which strip out time entirely, work better for long-term trend targets in noisy markets.
- Add your first indicator and set the timeframe. A daily chart suits swing trading; a 5 or 15-minute chart suits intraday work.
- Adjust the period to match your timeframe. Shorten oscillator periods for scalping or volatile crypto pairs, and lengthen them for position trades in large-cap stocks, which reduces whipsaw and matches sensitivity to actual market noise.
- Set colors and line thickness deliberately. Put lagging trend tools on the main price panel and momentum or volume oscillators in a subpanel below, so the two don’t visually compete.
- Save the layout as a template and apply it consistently across assets, so you’re comparing signals under the same conditions every time.
Set alerts around specific events rather than watching the screen all day: a MACD crossover, an RSI break above 70 or below 30, or price closing outside a Bollinger Band. You can also build ATR-based stop levels directly into your alert rules, so you’re notified when price approaches a stop calculated from actual recent volatility rather than an arbitrary percentage.
How Do You Backtest and Manage Risk With Indicators?
An indicator stack means nothing until you’ve tested it against history and put real risk controls around it. Skipping this step is how traders end up trusting a setup that only ever worked on one lucky chart.
Start with the basics:
- Define exact entry and exit rules before you look at results, not after.
- Test across multiple market regimes, meaning trending periods, range-bound periods, and high-volatility periods, not just the six months that happen to make your stack look good.
- Use walk-forward or out-of-sample validation, testing on one data segment and confirming on a separate one your rules never touched.
- Track win rate, expectancy, maximum drawdown, and risk-adjusted return rather than just a headline profit number.
Watch for the classic signs of overfitting: a strategy with more than four or five tunable parameters, a start date that happens to avoid every bad period, or rules that only make sense in hindsight. If your backtest looks perfect, that’s usually the clearest sign something is wrong with it.
Risk controls matter as much as the indicator signals themselves:
- Size positions using a fixed-fractional rule or an ATR-based stop, rather than a flat dollar amount that ignores current volatility.
- Set a maximum drawdown limit for your account and stop trading the strategy if you hit it.
- Decide upfront whether you’re running alert-only monitoring or automated order execution, since automation removes your ability to override a bad signal in real time.
A Worked Example: Turning Signals Into Alerts
Here’s how a simple three-indicator stack plays out in practice. Pick a 50-period EMA as your trend filter, RSI(14) as your momentum trigger, and OBV as volume confirmation. Your rule: go long when price is above the 50 EMA, RSI crosses back above 30 from oversold territory, and OBV is trending upward alongside price.
Rather than watching four charts at once waiting for that alignment, set alerts for each leg of the setup and let the notifications do the watching. Handy.Markets layers live indicator data across crypto, stocks, forex, and commodities and pushes alerts through Telegram, Discord, Slack, SMS, Webhook, or email the moment a threshold is crossed.
- Confirm any signal against actual price action, not just the indicator reading in isolation.
- Check volume or divergence before acting, especially on RSI or MACD signals that look extreme.
- Set your stop using ATR rather than a round number.
- Let alerts replace screen-staring, so you’re not forcing trades out of boredom.
Pro Tip: Set your OBV alert to trigger on a divergence from price, not just a directional move. That’s the setup most likely to catch a reversal before your trend indicator does.
What Experienced Traders Actually Do Differently
Traders who last keep their indicator set small, often the same three or four tools across every chart they touch, and document any parameter change with a reason attached. That habit alone prevents the constant tweaking that turns a decent strategy into noise.
Indicators filter and time decisions. They don’t predict markets with certainty, and treating a crossover as a guarantee is how confirmation bias creeps in. The real discipline is resisting the urge to trade every signal that fires, and resisting the urge to re-tune your settings the moment a trade loses. A losing trade inside a sound process isn’t a signal to change the process.
Put Your Indicator Stack to Work With Handy Markets
Reading an indicator correctly still depends on watching it at the right moment, and that’s the part most traders struggle with once real life gets in the way of a screen. Handy Markets solves the timing problem directly: instead of checking charts every hour hoping to catch a crossover, you set the alert once and let it reach you wherever you are.
The platform layers real-time price data with the indicators covered in this guide across cryptocurrencies, stocks, national currencies, commodities, and indices, and lets you save a chart template so your RSI, MACD, or Bollinger Band settings carry over consistently between assets. Alerts route through Telegram, Discord, Slack, SMS, Webhook, or email, so an ATR-based stop level or an OBV divergence doesn’t slip past you between meetings.
Head to the Handy to set up your first alert on a live chart and see how your indicator stack behaves in real conditions before you commit real capital to it.
FAQ
What are chart indicators used for?
Chart indicators translate raw price and volume data into visual signals for trend direction, momentum strength, volatility, and trading volume, helping you decide when a move is likely genuine and when to size or place a trade.
How many indicators should I use at once?
Two to four is the practical range most traders settle on. Beyond that, signals tend to contradict each other and slow down decision making rather than sharpening it.
Which indicator is best for beginners?
A moving average paired with RSI is a common starting point. The moving average shows trend direction while RSI flags overbought or oversold momentum, giving you two distinct, easy-to-read signals.
Do chart indicators work the same way on stocks, forex, and crypto?
The formulas stay identical, but crypto’s higher volatility usually calls for shorter oscillator periods and wider Bollinger Bands, while large-cap equities often perform better with longer, smoother settings.
How do I avoid false signals from indicators?
Confirm any crossover or threshold break with a second, different-category indicator, typically a volume tool, and check that the move holds up against actual price action before acting on it.
This article is general information, not a substitute for advice from a qualified financial advisor. Consult a qualified financial professional about your own circumstances before acting on anything here.
Sources