TL;DR:
- Effective price monitoring is an active discipline that helps traders detect risk early, read market sentiment, and act with confidence instead of panic.
- Structured alerts and metrics turn raw data into actionable intelligence, enabling better risk management and opportunity identification across all asset classes.
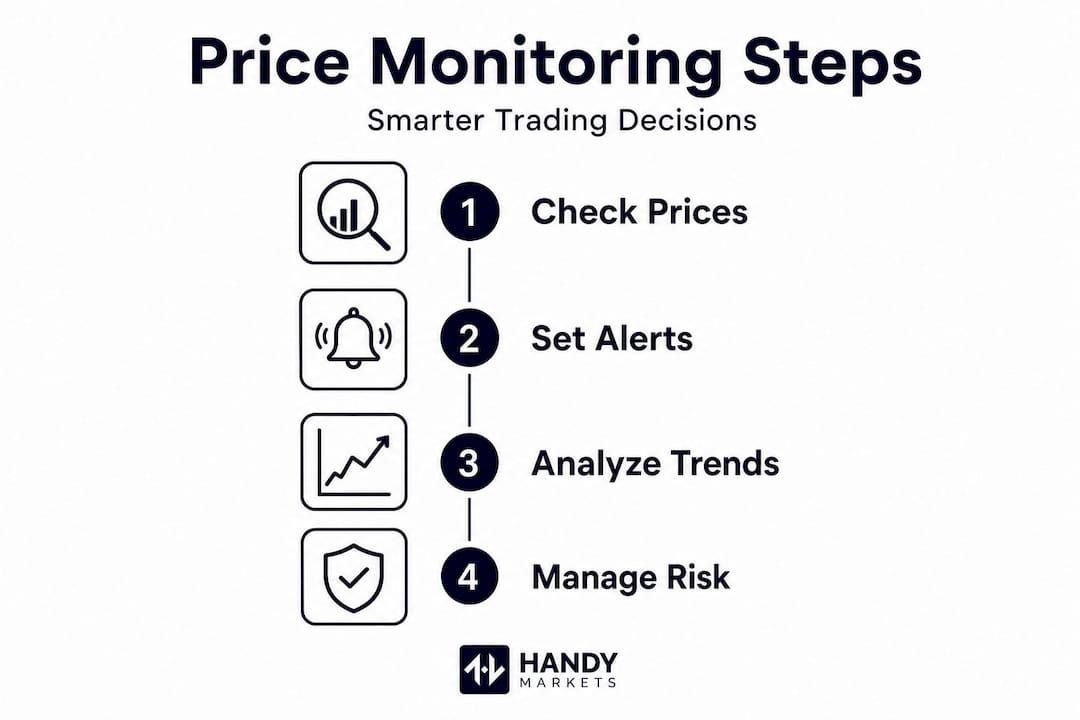
Most traders assume that watching prices is enough. You pull up a chart, see whether an asset is up or down, and move on. But that surface-level habit is one of the most common and costly mistakes in trading. Price monitoring, done right, is not about staring at numbers. It is about building a system that catches risk early, reads market sentiment before the crowd does, and gives you a clear framework for acting with confidence rather than panic. This article will walk you through why disciplined price monitoring matters, how it sharpens your risk and reward thinking, and what practical tools and strategies actually make a difference.
Table of Contents
- Why asset price monitoring matters in every market
- Risk, reward, and how monitoring supports smart decisions
- Reading between the lines: price movements as a window on sentiment
- Adapting your toolkit: timeframes, rules, and strategies for effective monitoring
- What most traders miss about asset price monitoring
- Take your price monitoring to the next level
- Frequently asked questions
Key Takeaways
| Point | Details |
|---|---|
| Early risk detection | Monitoring asset prices lets you identify problems before they escalate. |
| Improved decision quality | Tracking price changes helps you optimize risk/reward with up-to-date data. |
| Sentiment advantage | Price movements reveal market sentiment shifts that news may miss. |
| System over emotion | Rules-based monitoring keeps your decisions disciplined and effective. |
Why asset price monitoring matters in every market
Many traders treat price monitoring as a passive activity, like checking the weather before stepping outside. The truth is that effective monitoring is an active discipline that directly shapes outcomes. When you track prices without a structure, you are likely reacting to information after the fact. By the time a loss feels painful, the opportunity to limit it has often already passed.
Real-time market monitoring is the foundation of sound risk management across all asset classes. Whether you trade Bitcoin, oil futures, or tech stocks, every market has its own rhythm of volatility and liquidity. The pulsing nature of these markets means that a price move in one asset can quickly ripple into others. Cryptocurrencies, for instance, can swing 10% or more in a single session, while blue-chip stocks may shift 2% to 3% on earnings news. Commodities like crude oil can spike on geopolitical events with little warning. Each of these markets rewards traders who have set up clear thresholds and alerts in advance.
Research into portfolio monitoring practices shows that traders and investors monitor asset prices primarily to detect and manage risk early, including drawdowns, volatility spikes, and concentration drift, and to trigger disciplined actions rather than react emotionally. That distinction is everything. Reacting emotionally to a falling position leads to selling at the worst time. A pre-set rule saying “alert me when this position drops 5% from entry” converts panic into process.
Here are the core reasons systematic price monitoring pays off:
- Early risk detection: Catching a drawdown at 3% is far less painful than catching it at 15%. Small alerts give you time to act.
- Discipline over emotion: Rules-based systems reduce the psychological pressure that causes impulsive trades.
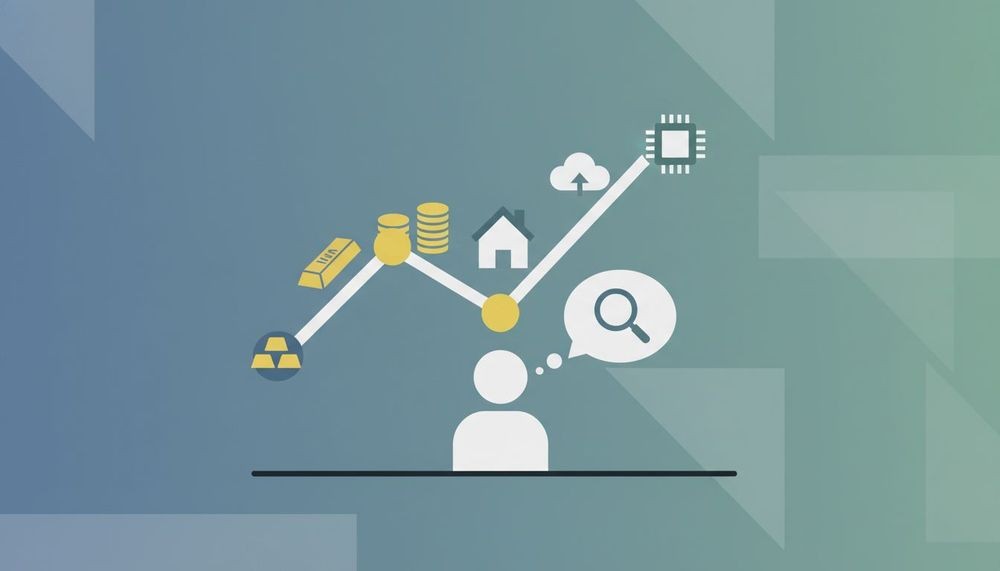
- Cross-asset awareness: Price moves in the dollar index often signal moves in gold or emerging market equities. Monitoring multiple assets gives you a broader map.
- Opportunity identification: Not all price moves signal danger. Breakouts from consolidation zones can represent genuine entry points for new trades.
- Portfolio rebalancing triggers: When one asset grows disproportionately large in your portfolio, monitoring helps you catch concentration drift before it becomes a risk.
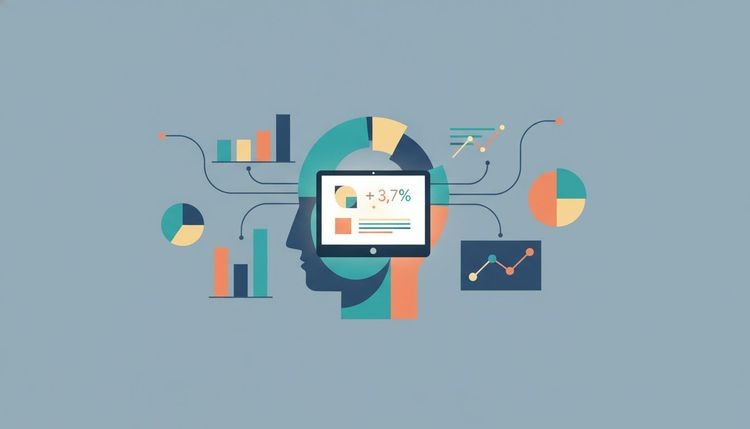
Additionally, the rise of AI-driven risk monitoring is changing how institutional and retail traders alike process price data in real time, making structured monitoring more accessible and actionable than ever before.
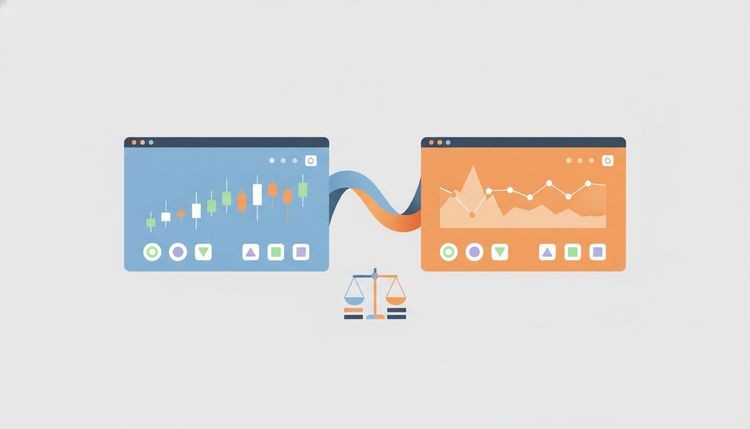
Risk, reward, and how monitoring supports smart decisions
With the core purpose established, it is time to break down how asset price monitoring actively shapes your risk and reward on every trade. Markets do not stand still, and neither should your assessment of whether a position still makes sense.

The risk/reward ratio compares the potential profit of a trade to its potential loss. A ratio of 2:1 means you expect to gain $200 for every $100 you risk. Simple enough in theory, but in practice, market conditions change constantly, and regularly monitoring and adjusting your risk/reward ratio is crucial as those conditions shift. A trade that looked like a 3:1 opportunity at entry can quickly become a 1:1 trade if volatility increases or price action weakens. Monitoring ensures you recognize that shift before it erodes your edge.
Risk metrics at a glance
| Metric | What it measures | Best suited for |
|---|---|---|
| Standard deviation | Price dispersion around the average | Comparing volatility across assets |
| Beta | Sensitivity to market-wide moves | Stock and equity portfolio management |
| Maximum drawdown | Largest peak-to-trough loss | Assessing downside in trend strategies |
| VIX | Market-wide implied volatility | Gauging fear and uncertainty in equities |
| Average true range (ATR) | Daily price range volatility | Setting stop-loss levels for active trades |
Understanding these metrics turns raw price data into actionable intelligence. The volatility checklist for traders is a practical reference for applying these concepts to live trades.
To reassess risk/reward on an active position, follow this structured approach:
- Record your original entry price and your initial stop-loss level. This is your baseline.
- Define your target price. Calculate the ratio: (target minus entry) divided by (entry minus stop).
- Set a price alert at 50% of the way to your target. At that point, review whether the trade setup still holds.
- Reassess after significant news or volatility events. A data release or policy change can fundamentally shift the picture.
- Adjust your stop-loss to break even once a trade has moved meaningfully in your favor. This removes downside risk from a winning position.
Pro Tip: Automate your risk monitoring wherever possible. Manual checking is inconsistent and tiring. Using alerts tied to specific price levels means your system does the watching while you focus on making better decisions. Tools built around market fluctuation analysis can help you identify the right levels to monitor without second-guessing yourself.
Reading between the lines: price movements as a window on sentiment
Beyond just managing risk, systematic price observation can help you read hidden market signals and sentiment shifts. Price is not just a number. It is the sum of every buy and sell decision made by every participant in the market at that moment. When you learn to watch price action in context, you begin to see the crowd’s psychology playing out in real time.
“Investor sentiment cycles have a direct impact on asset price performance. Quantitative tools let you measure what investors are actually doing, not just what they say.” — Charles Schwab market sentiment research
Sentiment often moves prices faster than underlying fundamentals. A company can report strong earnings, yet the stock drops because sentiment was already priced in. Similarly, Bitcoin can rally sharply not on adoption news but because short-sellers are being squeezed out of positions. Understanding the behavioral layer beneath price movement is a real edge.
Key sentiment metrics worth tracking alongside price:
- Put/call ratio: When more investors buy put options (bets on falling prices) versus calls, fear is rising. A spike in this ratio can signal capitulation, which sometimes precedes a reversal.
- ETF flows: Large inflows into sector ETFs indicate growing institutional interest. Outflows can signal distribution and potential weakness ahead.
- Short interest data: Rising short interest in a stock can either confirm a downtrend or set up a violent short squeeze if prices move against those positions.
- Hedge fund positioning: Futures commitment-of-traders (COT) reports reveal how large speculators are positioned in commodities and currencies, often a leading indicator.
- Retail trading activity: Platforms like Schwab track retail order flow through indices such as STAX to gauge where smaller investors are leaning. When retail sentiment is uniformly bullish, contrarian traders often take note.
Using market sentiment insights alongside your price monitoring gives you a richer picture of why prices are moving, not just that they are. The market monitoring guide explains how to integrate these signals into a structured monitoring routine that keeps you ahead of simple chart-watching. Combining market fluctuation strategies with sentiment awareness turns you from a passive observer into an active interpreter of market dynamics.
Adapting your toolkit: timeframes, rules, and strategies for effective monitoring
Understanding what to watch is only half the battle. Here is how to structure your monitoring practices for real impact, starting with the most fundamental alignment: matching your monitoring timeframe to your trading style.
Different trading styles demand very different monitoring frequencies. A scalper who holds trades for minutes needs intraday price alerts tied to tick-level movements. A swing trader who holds for days or weeks needs daily price action summaries and weekly sentiment reviews. A long-term investor may only need monthly portfolio reviews paired with alerts for major threshold breaches. Misaligning your monitoring with your strategy creates noise and stress without delivering clarity.
Research on volatility metrics confirms that different timeframes and volatility measures suit different needs and preferences. Maximum drawdown matters more to a trend follower than a day trader. Beta matters more to a stock picker than a crypto scalper. Matching the right metric to your actual strategy is the key to cutting through irrelevant data.
Here is a practical checklist for building a monitoring system that fits your approach:
- Define your trading style first. Scalper, swing trader, or long-term investor? Your answer determines everything below.
- Choose 3 to 5 assets to monitor closely. Depth beats breadth. Knowing one market well outperforms watching twenty markets poorly.
- Set entry and exit alert levels before you open any position. Write them down. This prevents emotional adjustments later.
- Assign a review cadence. Intraday for short-term traders, end-of-day for swing traders, weekly for position traders.
- Build a watchlist of correlated assets. If you trade gold, watch the dollar index and Treasury yields too.
- Use a volatility mastery guide to calibrate alert sensitivity. Too tight and you trigger constantly. Too wide and you miss key moves.
- Review and refine your setup monthly. Markets evolve. Your monitoring system should too.
Pro Tip: The biggest trap in price monitoring is over-checking. Checking your portfolio every 20 minutes while working another job or managing other responsibilities creates anxiety and leads to impulsive decisions. Structure wins. Set your alerts, define your review times, and let the system work for you. The market volatility guide offers a solid foundation for understanding how much movement is normal versus genuinely alarming.
What most traders miss about asset price monitoring
Stepping back, let us address a fundamental and costly mistake that even experienced market participants make. The mistake is not ignoring prices. It is monitoring them without context, structure, or purpose.
We see this pattern repeatedly. A trader sets up a brokerage app, watches their positions refresh every few minutes, and convinces themselves they are “on top of the market.” But frequent, unstructured checking is not the same as disciplined monitoring. In fact, research in behavioral finance consistently shows that investors who check their portfolios most often tend to trade more and perform worse. The noise of short-term price fluctuations triggers the same stress response as physical danger, pushing traders toward impulsive sells and panic exits.
The antidote is not less engagement, it is better-designed engagement. Think about the difference between a hospital’s heart monitor and someone obsessively checking their own pulse every two minutes. The monitor alerts only when something deviates from a safe range. It does not generate anxiety during normal function. That is the model disciplined traders should build.
Structured alerts and context-aware dashboards outperform manual price watches for one simple reason: they convert subjective anxiety into objective signals. Instead of asking “is this bad?” you are asking “has this crossed my pre-set threshold?” One question invites panic. The other invites a plan. The market fluctuation analysis insights available today make it easier than ever to build that kind of context around your data.
Consider a hypothetical but realistic scenario. A trader monitors an energy ETF manually each morning. One day, distracted and stressed, they glance at a 4% intraday drop and sell. The position recovers by close. With a rule-based alert, that same trader would have received a notification only if the asset closed below a 7% weekly threshold, triggering a calm end-of-day review instead of a mid-session panic exit. That single structural difference is worth more than hours of chart study.
Take your price monitoring to the next level
You now understand that the real power of price monitoring lies not in the frequency of checking, but in the quality and structure of how you engage with market data. Knowing when to act, what signals to watch, and which thresholds actually matter separates the investors who grow their portfolios from those who chase noise.
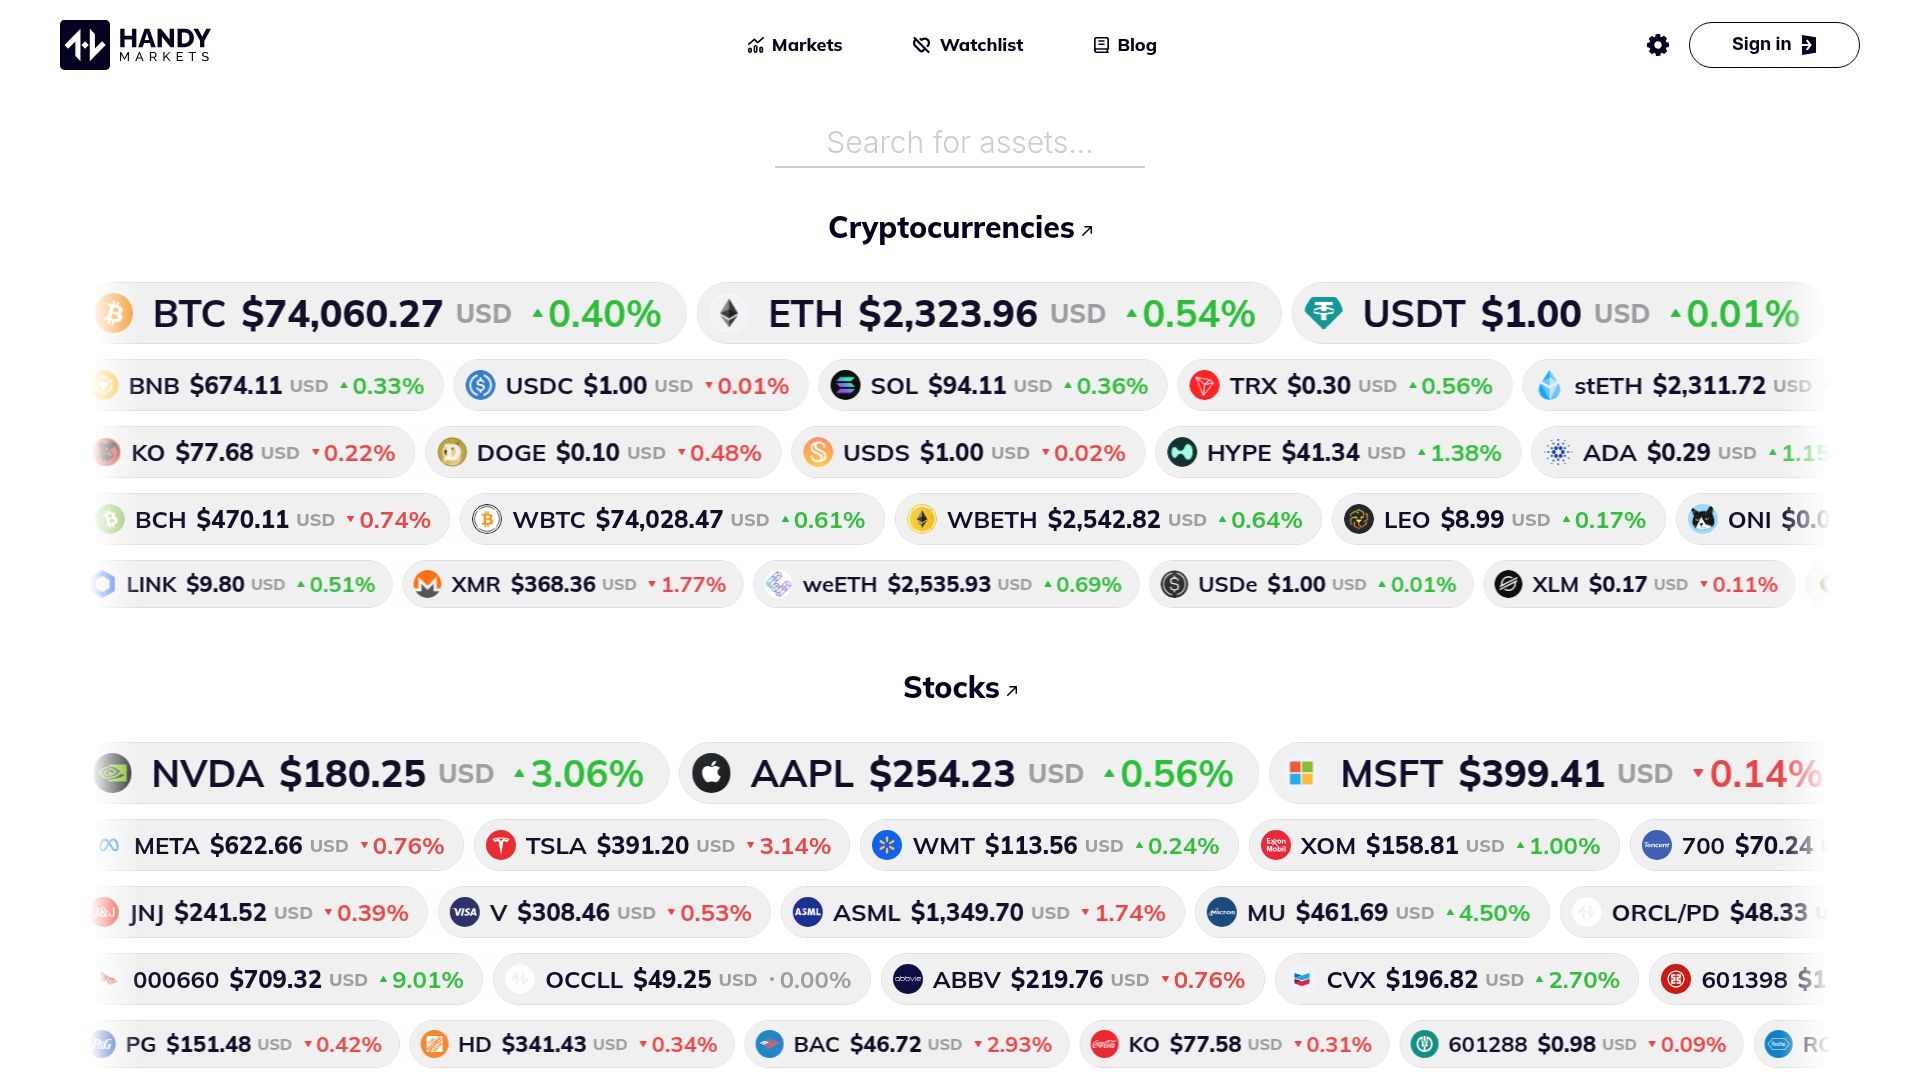
Handy.markets gives you a clean, customizable platform to put these principles into action immediately. You can set up price alerts across cryptocurrencies, stocks, commodities, indices, and foreign exchange, delivering notifications to Telegram, Discord, Slack, SMS, email, or webhook. The setup takes minutes, and alerts are fully customizable to your specific thresholds and strategy. You can also track all your assets in one place, with live prices and percentage changes at a glance, so your monitoring stays organized and efficient without switching between multiple tools or platforms.
FAQ
How often should you check asset prices as an investor?
Check prices according to your strategy, not your emotions. Active traders may monitor intraday, while long-term investors can review weekly or monthly. Matching your timeframe to your strategy reduces unnecessary stress and avoids impulsive decisions.
What is the main purpose of monitoring asset prices?
The main purpose is to manage risk, detect emerging trends, and make timely, informed decisions. Systematic monitoring helps investors identify potential problems early, before small losses grow into large ones.
How does monitoring prices help with risk/reward?
Price monitoring lets you continuously reassess whether a trade still offers a favorable risk/reward ratio as conditions change. Regular reassessment of potential profit versus potential loss is essential for maintaining an edge over time.
What’s an example of a price-based alert?
A typical alert triggers when an asset drops 5% from your entry price, signaling it is time to review your position. Rules-based alerts like this convert price movements into predefined actions, replacing emotional reactions with structured responses.