TL;DR:
Market data underpins informed trading by providing vital insights into market conditions and liquidity. Better quality and real-time data enhance trading activity, improve market efficiency, and reduce costs through more accurate price impact assessments. Traders must carefully adapt data interpretation to different asset classes and trading mechanisms to maintain a competitive edge.
Most traders obsess over price charts, but the real edge lives in the data underneath. The quality, depth, and timeliness of market data you access directly shapes whether your trades are profitable or costly. Recent academic research now confirms what top institutional traders have quietly known for years: better market data does not just inform decisions, it measurably changes trading behavior, improves liquidity, and can ultimately determine whether a strategy succeeds or fails. In this article, we break down what market data actually includes, how it affects your results, and what mistakes even experienced traders keep making.
Table of Contents
- What is market data and why does it matter?
- How market data shapes trading activity and liquidity
- Understanding price impact: why costs differ by market mechanism
- Common market data mistakes and how to avoid them
- What most traders overlook about market data
- Turn better data into better trades with Handy.Markets
- Frequently asked questions
Key Takeaways
| Point | Details |
|---|---|
| Market data drives trading | Access to high-quality market data directly increases trading activity and liquidity. |
| Price impact shapes profits | Measuring price impact with accurate data is essential for understanding execution costs. |
| Tailor data to your asset | Different assets and mechanisms require context-specific data for smart decisions. |
| Mistakes reduce returns | Avoid treating all data the same—interpret results in light of trading context and market structure. |
| Tools can level the field | Modern platforms let both pros and new investors act on real-time insights for smarter trading outcomes. |
What is market data and why does it matter?
Market data is the lifeblood of informed trading. At its core, it is any stream of information that describes the current state and recent history of a financial market. That covers a wide range, and understanding exactly what is included helps you know which data feeds are worth your attention.
The key components of market data include:
- Quotes: The best available bid (buy) price and ask (sell) price at any moment, typically called the “top of book”
- Trade prints: Every confirmed transaction, including price, volume, and timestamp
- Order book depth: A ranked list of all pending buy and sell orders at various price levels, showing true supply and demand
- Volume data: Total shares, contracts, or coins traded over a given period
- Historical data: Past trades and quotes, used for backtesting strategies and spotting trends
Level 1 vs. level 2 data
There is an important distinction between Level 1 and Level 2 data feeds that every trader should know. Level 1 gives you the best bid and best ask, basically the surface of the market. Level 2 shows you the full order book, meaning all the pending buy and sell orders stacked at multiple price levels. For stocks, this is sometimes called the “depth of market” or DOM.
For crypto traders, Level 2 data is especially revealing because it exposes large orders being placed or cancelled well before they hit the tape. For commodity traders, it helps identify support and resistance zones that price alone cannot show. Accessing good real-time market data is no longer optional for anyone trading with real money.
The difference between real-time and delayed data
Real-time data arrives within milliseconds of a transaction occurring. Delayed data, often 15 to 20 minutes behind, used to be the default for retail traders and is still offered free on many platforms. For a long-term investor, a 15-minute delay might seem trivial. For an active trader, it is the difference between catching a move and chasing it.
“Empirical research supports a causal link between market data products and trading activity: providing higher-quality order-book depth information can increase trading on the venue and also spill over to non-subscribers via liquidity/externalities.” — Hendershott’s NYSE Integrated Feed study
This finding is significant. Better data does not just help the traders who pay for it. It improves the entire market environment. Understanding market data trends helps you stay current as data products evolve rapidly across all asset classes.
How market data shapes trading activity and liquidity
Now that we know what market data covers, let’s explore the actual impact that data access can have on trading activity and market liquidity.
Liquidity, the ease with which you can buy or sell an asset without significantly moving its price, does not exist in a vacuum. It is created and maintained by traders who participate in markets actively. And those traders need good data to do that confidently.

The NYSE Integrated Feed study: a real-world example
When the New York Stock Exchange introduced its NYSE Integrated Feed (NYSE IF), researchers got a rare opportunity to measure what happened when traders received meaningfully better order-book depth information. The results were striking.
| Metric | Before NYSE IF | After NYSE IF |
|---|---|---|
| Average trading activity (subscribers) | Baseline | Increased significantly |
| Average trading activity (non-subscribers) | Baseline | Also increased (spillover) |
| Liquidity depth | Standard | Improved across the book |
| Price discovery efficiency | Baseline | Measurably improved |
The NYSE IF research found a roughly 1 percentage point increase in trading activity, equivalent to an 8.6% rise relative to the pre-event baseline. Critically, this benefit was not limited to traders who subscribed to the new feed. Non-subscribers also saw improved conditions through market-wide liquidity externalities.
Statistic to note: An 8.6% increase in trading activity from a single data product improvement. This is not a marginal gain. It reflects how foundational data quality really is.
What this tells us practically is that when more traders have access to better order-book depth, the entire market becomes more efficient. Spreads tighten. Price discovery improves. Everyone benefits, whether they are trading Bitcoin, S&P 500 stocks, or crude oil futures.
Pro Tip: When comparing trading platforms or data providers, ask specifically about order-book depth, not just whether they offer “real-time quotes.” Level 2 data is often the difference between seeing the market and truly understanding it.
A good market monitoring guide can help you set up systems that capture this depth consistently. And when you need to make sense of sharp moves, structured market fluctuation analysis gives you a repeatable framework to work with.
Understanding price impact: why costs differ by market mechanism
With liquidity and trading activity clarified, let’s focus on pricing impact, a critical and often misunderstood cost that shapes real-world performance.
Price impact refers to the change in an asset’s price caused by your own trade. When you place a large buy order, you push the price up slightly as your order consumes available liquidity. When you sell a large position, you push the price down. These are real costs that do not appear on a commission statement but show up directly in your returns.
Price impact varies by market mechanism
Here is something most retail traders do not realize: price impact is not the same across all trading sessions or market types. A Cambridge JFQA study on price impact research found that the mechanism used to match buyers and sellers matters enormously.
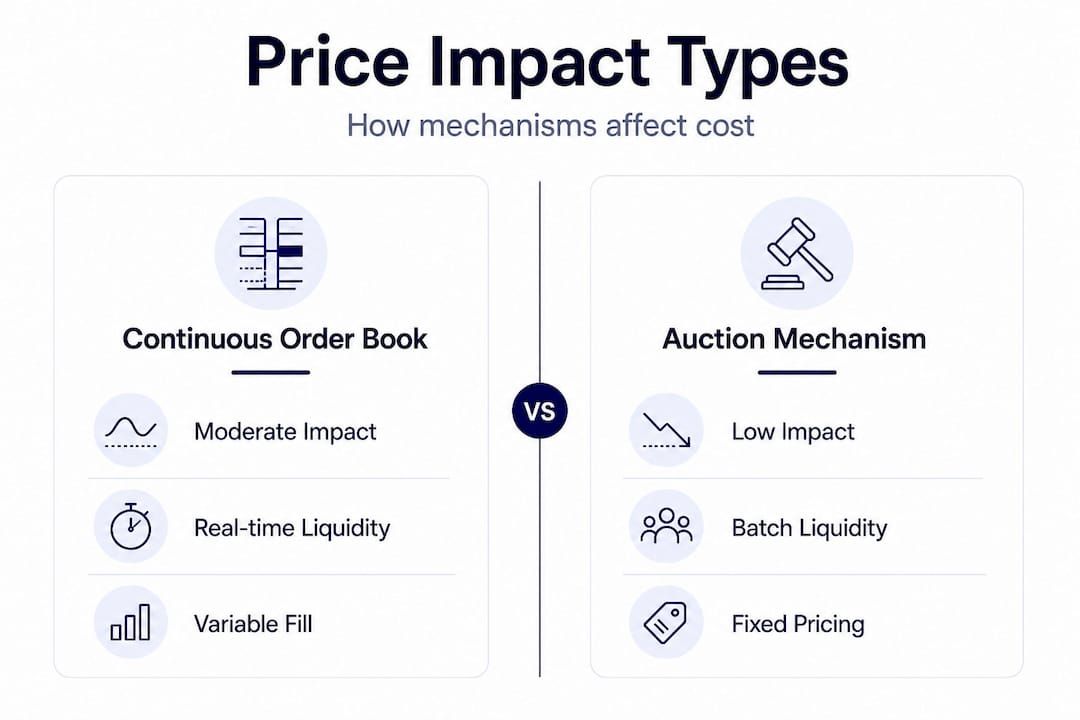
| Trading mechanism | Typical price impact level | Best suited for |
|---|---|---|
| Continuous order book | Moderate, varies by liquidity | Intraday active trading |
| Opening auction | Lower for large orders | Institutional block trades |
| Closing auction | Often lowest price impact | End-of-day rebalancing |
| Thinly traded markets | Very high | Caution required |
The research confirms that trading cost benchmarks must account for which mechanism is being used. A strategy that appears profitable in backtesting using continuous market data may actually lose money if trades are executed during low-liquidity windows where price impact spikes.
Steps to assess price impact using market data
- Check the bid-ask spread before placing an order. A wider spread signals lower liquidity and higher likely price impact.
- Look at order book depth at multiple price levels. If the book is thin beyond the top of book, your order will move the price more than expected.
- Compare volume at your target time versus the asset’s average daily volume. Trading during high-volume windows reduces price impact.
- Examine the trading mechanism for your specific asset. Stocks, ETFs, and major crypto pairs often use continuous books; some structured products use periodic auctions.
- Factor in the asset class. Crypto markets run 24 hours and have variable liquidity by hour. Commodities have defined trading sessions. Stocks have opening and closing auction windows that behave very differently from continuous hours.
Pro Tip: For execution-focused strategies, always model trading costs separately for auctions and continuous sessions. Assuming a single average cost per trade will silently erode your returns over time.
Using detailed market analysis techniques and learning how to compare financial markets across asset classes gives you the context to apply these steps accurately.
Common market data mistakes and how to avoid them
With a strong grasp of price impact, it is equally important to recognize mistakes even experienced traders make when using market data.
Even traders who understand the theory often fall into practical traps. Here are the most common ones, and how to avoid them.
Mistake 1: Treating all liquidity as the same
Not all markets with the same dollar volume behave the same way. A crypto token that trades $50 million per day on a centralized exchange with a deep order book is very different from a small-cap stock with $50 million in volume concentrated in a few large block trades. The distribution of volume across price levels matters as much as the total. Context is everything.
Mistake 2: Confusing order book depth with fill probability
Seeing large orders sitting in the order book does not guarantee your order will fill at those prices. Large orders are routinely cancelled or partially filled. Iceberg orders, which show only a fraction of their true size, are common in institutional trading. Order book depth tells you the current shape of supply and demand, not a promise about execution.
Mistake 3: Ignoring trading mechanism differences
Many traders use a single liquidity metric when modeling execution costs across different sessions and asset classes. As the Cambridge research shows, mechanism-specific cost modeling is essential. Auctions behave fundamentally differently from continuous books. Missing that distinction leads to strategies that underperform their projections.
Mistake 4: Relying on lagging indicators when real-time data is available
Using delayed order flow data, end-of-day summaries, or 15-minute delayed quotes while making real-time decisions is like navigating with a map from three months ago. Modern platforms provide the tools to stay current. Use them.
Pro Tip: Always tailor your data interpretation to the specific asset, venue, and trading session. A framework that works for equities during continuous trading hours will need adjustment for crypto at 2 a.m. or for commodity futures near settlement.
Keeping up with a solid market indicators list and having clear volatility strategies in place will help you catch these mistakes before they cost you.
What most traders overlook about market data
The common advice is to “follow the tape” and let the data speak for itself. That is not wrong, but it is incomplete. Here is the contrarian truth we have observed: most traders treat market data as a passive input when it is actually an active lens that needs constant recalibration.
The rise of algorithmic and automated trading has made granular, high-quality data more critical than ever. Algorithms react to order book changes in microseconds. When a retail trader is looking at a 15-second chart, an algorithm has already processed thousands of order book events in that same window. This asymmetry does not mean retail traders cannot compete, but it does mean that the quality and freshness of data you use is no longer a luxury. It is a baseline requirement.
We also notice that even data-savvy traders often skip the step of questioning which data is relevant to their specific strategy. A momentum trader needs very different data than an options seller or a long-term value investor. Buying a premium data feed and using it the same way across all strategies is like having a precision instrument but using it as a blunt tool.
The deepest lesson here is that being truly data-driven means adapting to how market microstructure evolves, not just subscribing to the latest feed. Markets change. New trading venues emerge. Liquidity patterns shift. The traders who stay ahead are the ones who consistently re-examine their data assumptions and test new frameworks rather than relying on static setups.
We recommend building the habit of asking two questions regularly: Is this data source still the right one for this strategy? And am I interpreting it in a way that accounts for today’s market structure? Resources like mastering market trends can help you develop that adaptive mindset over time.
Turn better data into better trades with Handy.Markets
Understanding the power of market data is the first step. Putting it into practice requires the right tools in one place.
At Handy.Markets, we make it easy to monitor live crypto prices and real-time stock quotes across multiple asset classes without juggling multiple platforms. You can personalize your watchlists, monitor order-level data, and stay on top of price movements across crypto, equities, commodities, and forex from a single dashboard. Most importantly, you can set up price alerts in minutes through Telegram, Discord, Slack, SMS, Email, or Webhook, so you never miss a critical market move. Better data is available. The question is whether you are using it.
FAQ
What types of market data are most important for active traders?
Order book depth, trade prints, and real-time quotes are essential for active traders to gauge liquidity and make fast decisions, because higher-quality depth information has been shown to directly increase trading activity and market efficiency.
How does market data help reduce trading costs?
It reveals price impact and liquidity depth, allowing traders to optimize order size, timing, and venue selection. Research confirms that empirically measured price impact from market data determines whether execution-focused strategies are profitable net of costs.
Is all market data equally valuable for different assets?
No. Liquidity and price impact vary significantly by asset class and trading mechanism, which is why mechanism-specific cost modeling is essential for accurate trade planning.
Can better market data improve returns for regular investors, not just professionals?
Yes. The NYSE IF study findings show that improved data access benefits all market participants, including non-subscribers, through spillover effects that tighten spreads and improve price discovery across the board.
Recommended
- Market Monitoring Guide: Real-Time Alerts For Traders | Handy.Markets
- Real-Time Market Data Guide For Traders And Investors 2026 | Handy.Markets
- Stock Market Indicators: Essential List For Smarter Trading | Handy.Markets
- Market Analysis Techniques 2026: Advanced Approaches For Analysts | Handy.Markets
- Trading models: Data-driven strategies for smarter decisions