TL;DR:
- Economic indicators serve as vital signs of an economy, influencing market expectations and asset prices.
- Interpreting these data points requires understanding their timing, revisions, and broader context to avoid misleading signals.
The same jobs report can send stocks soaring one morning and crashing the next, even when the headline number looks identical. That’s the uncomfortable reality traders face: economic indicators are data-driven signals reflecting an economy’s condition, but reading them correctly is far from automatic. Most traders see the number, compare it to expectations, and react. The ones who consistently profit dig deeper, understanding timing, revision cycles, and the broader context that separates a genuinely useful signal from misleading noise.
Table of Contents
- What are economic indicators and why do they matter?
- Types of economic indicators: Leading, coincident, and lagging
- How economic indicators are calculated and released
- Data revision risk: Why initial numbers aren’t the full story
- Applying economic indicators in trading: Practical tips for interpreting market signals
- Why interpreting economic indicators is both art and science
- Stay ahead with real-time tools from Handy.Markets
- Frequently asked questions
Key Takeaways
| Point | Details |
|---|---|
| Indicators drive markets | Economic indicators shape trading decisions and quickly move prices after release. |
| Know your indicator types | Leading, coincident, and lagging indicators offer distinct clues for different trading strategies. |
| Beware data revisions | Initial economic data is often revised, which can impact market analysis and backtesting. |
| Interpret in context | Smart traders triangulate across indicators and monitor for shifts and regime changes. |
| Use the right tools | Real-time data, alerts, and robust methodology provide an edge in responding to indicator-driven moves. |
What are economic indicators and why do they matter?
At their core, economic indicators are macroeconomic data points used to assess the direction and health of an economy. Think of them as the vital signs of a living financial system, pulsing with information about growth, inflation, employment, and consumer confidence. They don’t just reflect what already happened. They shape what traders and investors expect to happen next.
When the Bureau of Labor Statistics releases the Consumer Price Index (CPI) or the Commerce Department publishes Gross Domestic Product (GDP) figures, markets often react within seconds. Prices in equities, bonds, currencies, and commodities can all shift sharply. The reason is simple: institutions and algorithms are constantly recalibrating their outlook based on new data. If you’re not interpreting that data correctly, you’re effectively trading blind.
Here’s why economic indicators deserve more than a surface-level glance:
- Consumer Price Index (CPI): Tracks inflation by measuring changes in the cost of a basket of goods and services. A higher-than-expected CPI often signals tighter monetary policy ahead, which can pressure stock valuations.
- Gross Domestic Product (GDP): Measures the total value of goods and services produced. It reveals whether an economy is expanding or contracting, which broadly affects corporate earnings expectations.
- Unemployment Rate: Reflects the percentage of people actively seeking work but unable to find it. Low unemployment often correlates with stronger consumer spending, which feeds into broader market optimism.
- Nonfarm Payrolls (NFP): A monthly count of jobs added outside the agricultural sector, widely regarded as one of the most market-moving releases on the calendar.
Mere awareness of these indicators isn’t enough. Knowing that CPI measures inflation is easy. Understanding why a hotter CPI reading in a slowing economy might actually be bearish for both stocks and bonds simultaneously, that’s where real interpretation skills begin. Exploring essential stock market indicators can help you build that deeper foundation.
“A number in isolation is just noise. A number in context is a signal worth trading.”
With a clear sense of why economic indicators matter, let’s examine their main types and how each shapes market expectations.
Types of economic indicators: Leading, coincident, and lagging
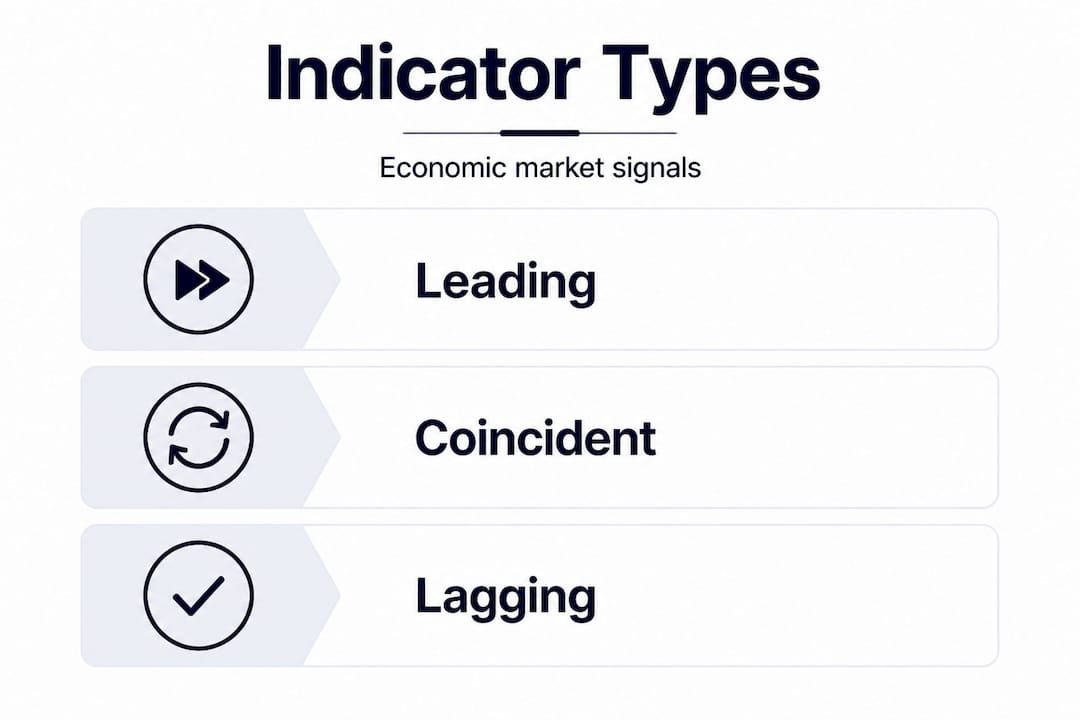
Economic indicators don’t all operate on the same clock. Indicators are commonly grouped by timing: leading, coincident, or lagging, and understanding these categories fundamentally changes how you use them in trading.
| Type | Definition | Key examples | Trading relevance |
|---|---|---|---|
| Leading | Signals future economic direction | Stock market returns, building permits, yield curve | Anticipate turning points before they happen |
| Coincident | Reflects current economic conditions | Industrial production, personal income, retail sales | Confirm whether the economy is expanding or contracting right now |
| Lagging | Confirms trends after the fact | Unemployment rate, CPI, prime rate | Validate what leading indicators already suggested |
Leading indicators are the most exciting for traders because they hint at where things are going. Building permits, for example, reflect future construction activity and broader economic momentum. The yield curve, specifically the spread between 2-year and 10-year Treasury yields, has historically preceded recessions with remarkable accuracy. But here’s the catch: leading indicators are not guarantees.
Coincident indicators tell you what’s happening right now. Industrial production figures, for instance, closely track economic cycles and give you a real-time snapshot of manufacturing health. They’re useful for confirming whether your leading indicator thesis is actually playing out.
Lagging indicators confirm what has already happened. The unemployment rate, despite being closely watched, often peaks after a recession has technically ended. If you trade solely on lagging signals, you’re frequently late to the party.

Composite index indicators like the Conference Board’s Leading Economic Index (LEI) and Coincident Economic Index (CEI) bundle multiple series together to reduce noise and better identify genuine business-cycle turning points. Rather than relying on a single metric, composite indices smooth out the quirks in any individual dataset. For traders comparing financial markets across asset classes, these composite tools offer a broader and more reliable lens.
Pro Tip: Leading indicators can give false signals, especially during unusual economic regimes like post-pandemic recoveries or supply-chain disruptions. Always cross-reference with coincident data before building a large position around a single leading signal.
Now that you know the categories, let’s reveal how the underlying numbers are created and why traders should care.
How economic indicators are calculated and released
Numbers don’t materialize from thin air. Indicator mechanics depend on how the underlying data are collected and processed, and that process is messier than most traders assume. Here’s a simplified breakdown of how a major indicator, like the Monthly Employment Situation, gets made:
- Survey design: Agencies like the Bureau of Labor Statistics (BLS) survey thousands of businesses and households each month, capturing payroll counts, hours worked, and wages.
- Data editing and weighting: Raw responses are cleaned, adjusted for known errors, and weighted to represent the broader economy. Seasonal adjustment factors are applied to remove predictable fluctuations like holiday hiring.
- Preliminary estimation: Initial estimates are calculated and prepared for release. These are often based on incomplete survey returns, meaning not all respondents have replied yet.
- Public announcement: The headline number goes live, usually at 8:30 a.m. Eastern Time, moving markets almost immediately.
- Benchmarking and revision: Later, as more complete data arrives, figures are revised. Employment statistics undergo an annual benchmark revision that can shift previously reported figures by tens or hundreds of thousands of jobs.
| Indicator | Source | Release frequency | Revision schedule |
|---|---|---|---|
| Nonfarm Payrolls | BLS | Monthly | Monthly revisions, annual benchmark |
| GDP | Bureau of Economic Analysis | Quarterly | Advance, second, third estimate |
| CPI | BLS | Monthly | Rare revisions, but methodology changes occur |
| Retail Sales | Census Bureau | Monthly | Revised the following month |
Understanding real-time market data helps you react correctly when an initial print hits. But knowing how that print was made helps you judge how much trust to place in it. Tracking live market prices in the minutes after a release often reveals whether the market’s reaction is a clean move or an overreaction waiting to reverse.
Pro Tip: GDP releases come in three stages: advance, second, and third estimates. The advance estimate moves markets most aggressively, but it’s often the least accurate. The gap between advance and final GDP can sometimes exceed a full percentage point.
Knowing how the data arrives is vital, but trading success comes from reading the signals wisely, especially when numbers are revised.
Data revision risk: Why initial numbers aren’t the full story
Here’s a scenario that trips up even experienced traders. Nonfarm Payrolls come in at 180,000 jobs added, beating expectations of 150,000. Markets rally. Two months later, a revision quietly drops that figure to 130,000, well below expectations. The initial trade was built on data that turned out to be wrong.
Early indicator releases can differ substantially from later “final” values, and these revisions create real trading risk that most market participants underestimate. Vintage data, meaning the specific version of a data series that existed at a particular point in time, matters enormously for backtesting strategies. If you backtest using today’s revised figures and not the figures that were actually available when signals fired, your results will be misleading.
Common pitfalls when trading on “first print” data:
- Overconfidence in headline beats: A single data point beating expectations often masks weakness in underlying components.
- Ignoring revision history: Some series, like initial jobless claims, are relatively stable. Others, like construction spending, are routinely revised by large margins.
- Anchoring to the initial number: Traders sometimes continue referencing the first print even after a meaningful revision, leading to misaligned market narratives.
- Backtesting with revised data: Using “clean” historical data rather than the messy vintage data available at the time creates strategies that look better on paper than they perform in reality.
Tracking market data trends helps you stay calibrated to the current data environment, while mastering market trends over time builds the intuition to know when a revision is likely and how markets have historically responded.
Pro Tip: Build a personal log of which indicators you trade most, and note their historical revision magnitudes. When a series with a history of large revisions posts a big beat or miss, widen your stop-loss or reduce position size until a confirmation revision follows.
You’ve learned how indicator numbers aren’t always static. Next, let’s apply this operational knowledge to actual market moves and strategy.
Applying economic indicators in trading: Practical tips for interpreting market signals
Knowledge without action doesn’t generate returns. Here’s a clear framework for integrating economic indicators into your actual trading process.
- Check the release calendar in advance. Know which indicators are scheduled for the week, their expected values, and their historical market impact. Nonfarm Payrolls, CPI, and Federal Reserve rate decisions consistently generate the most volatility.
- Assess expectations, not just the number. Markets price in consensus forecasts before a release. The surprise component, the gap between actual and expected, drives the initial price move. A strong number that merely meets expectations often produces muted reactions.
- Review the indicator’s revision history. Before trading the first print, ask yourself: is this a series known for large revisions? If yes, wait for confirmation or size your position conservatively.
- Triangulate across multiple datasets. One indicator rarely tells the whole story. Combine CPI with retail sales and wage growth to form a richer picture of inflationary pressure.
- Monitor the market’s reaction, don’t just predict it. Sometimes markets trade against the obvious interpretation. A strong NFP number that causes a bond sell-off but no equity rally signals something deeper. That divergence is worth understanding.
- Apply indicators within a broader framework. Robust market monitoring focuses on trend triangulation across multiple series, not reacting to single data points in isolation.
Bullet checklist for each major release:
- Note the consensus estimate and any whisper number circulating
- Identify which asset classes are most sensitive to this specific indicator
- Set price alerts before the release so you capture the move without scrambling
- After the release, note the magnitude of the surprise and the speed of the market reaction
- High-frequency timing and data-vintage issues create backtesting pitfalls, so record what data was available at the time of your trade
Applying market fluctuation analysis methodologies alongside indicator releases deepens your read on price behavior. Combining that with advanced market analysis techniques helps you build more resilient strategies, while a market volatility checklist keeps your risk management sharp during high-impact release windows.
Pro Tip: Treat economic indicators as signals within a broader framework, not isolated triggers. One data point rarely changes a trend. But when multiple indicators align, and the market confirms with price action, that convergence is worth acting on.
With a toolkit for interpreting indicators, let’s explore how experienced traders move beyond the basics to find real edge.
Why interpreting economic indicators is both art and science
Most traders approach economic indicators looking for a simple verdict: good or bad, buy or sell. That instinct is understandable. It’s also where most money gets lost.
The herd consistently gravitates toward consensus interpretations. When CPI comes in hot, the reflex is to short bonds and sell growth stocks. Sometimes that’s exactly right. But in a market that has already priced in aggressive rate hikes, a hot CPI print might trigger a “buy the news” rally as traders unwind their short positions. Surface-level reading leads you straight into consensus trades, and consensus trades rarely carry an edge.
Real advantage comes from contextual awareness. What revision cycle is this indicator currently in? Has the series been systematically revised upward or downward over recent months? Is the market in a regime where bad economic news is treated as good news because it signals policy easing? These are the questions that separate thoughtful analysis from reflexive reactions.
Developing a process-oriented mindset is what makes the difference over time. This means documenting your pre-release thesis, noting the actual outcome, tracking the market’s reaction, and recording any revisions that follow. Over time, this log becomes one of your most valuable trading assets. It reveals your own cognitive biases and exposes which indicators you actually have an edge in reading.
Real-time market monitoring is the infrastructure that supports this process. Without live data and timely alerts, even the best analytical framework arrives too late.
Stay ahead with real-time tools from Handy.Markets
Understanding indicators is one side of the equation. Acting on them in real time is the other.
At Handy.Markets, we built our platform specifically for traders who want to stay ahead of market-moving events without drowning in complexity. You can monitor live crypto market data, set up free price alerts across Telegram, Discord, Slack, SMS, Email, and Webhook, and track global markets across stocks, forex, commodities, and indices, all in one place. When a surprise CPI release hits or payrolls deviate from expectations, your alerts fire instantly, giving you the reaction time that makes informed trading possible. Don’t let critical market moves pass while you’re checking a separate tab.
FAQ
What is an economic indicator in simple terms?
Economic indicators are macroeconomic data points used to assess economic direction, such as GDP measuring growth or the unemployment rate tracking job market health.
Which economic indicators move financial markets the most?
The biggest market movers include Nonfarm Payrolls, CPI, GDP, and central bank rate decisions, as CPI, GDP, and unemployment figures directly influence expectations for monetary policy and corporate earnings.
Why do indicator numbers sometimes change after their first release?
Early releases can differ from later “final” values because initial estimates are based on incomplete survey data, and revisions arrive as more responses and benchmark data become available.
How often are economic indicators released?
Most major indicators, such as CPI and employment figures, are released monthly, while GDP comes out quarterly. Some high-frequency series like weekly jobless claims provide faster but noisier signals.
Can traders rely on a single indicator for decisions?
No. Composite indicators using multiple series consistently outperform single data points for identifying genuine economic turning points, and combining multiple signals reduces the risk of acting on misleading noise.
Recommended
- Stock Market Indicators: Essential List For Smarter Trading | Handy.Markets
- Why Track Stock Indices? Smarter Investing In 2026 | Handy.Markets
- How To Compare Financial Markets: A Guide For Investors | Handy.Markets
- Mastering Market Trends: 13% Annual Returns Proven Strategy | Handy.Markets
- How to Use Economic Indicators in Trading — A Complete Guide for 2025 - My Framer Site
- Essential trading performance metrics with real examples – DayProp Funding