TL;DR:
- Effective market data monitoring involves continuously verifying the timeliness, completeness, and freshness of price feeds to prevent costly trading errors. Automated tools like synthetic probes, passive listeners, and cross-vendor reconciliation are essential for real-time anomaly detection, with alerts calibrated to strict SLAs. Building an adaptive, culture-driven process that regularly reviews thresholds and logs anomalies enhances data integrity and trading confidence.
Stale prices. Missing ticks. A feed that went silent thirty seconds before a major move. For active traders and investors, bad data is not a minor inconvenience but a direct line to costly errors and missed opportunities. The difference between a winning strategy and a blown position often comes down not to market instinct but to whether your data infrastructure is actually doing its job. This guide walks you through the complete market data monitoring process, from foundational definitions to advanced anomaly detection, so you can trade and invest with real confidence in the numbers you see.
Table of Contents
- What is market data monitoring and why does it matter?
- Core components and requirements: What tools and metrics do you need?
- Step-by-step: How to implement effective market data monitoring
- Verifying results: Detecting, diagnosing, and correcting data anomalies
- Our take on market data monitoring: What most guides miss
- Take your market data monitoring to the next level
- Frequently asked questions
Key Takeaways
| Point | Details |
|---|---|
| Monitor four key metrics | Track latency, completeness, freshness, and availability to ensure accurate market data feeds. |
| Automate continuous monitoring | Set up automated, real-time alerts to quickly detect and respond to data anomalies. |
| Diversify detection methods | Use synthetic probes, passive listeners, and cross-vendor checks for robust coverage. |
| Act promptly on alerts | Investigate and resolve anomalies immediately to maintain data integrity and trading performance. |
| Keep evolving your process | Regularly refine monitoring rules and tools as markets, assets, and data vendors change. |
What is market data monitoring and why does it matter?
Market data monitoring is the continuous process of checking price feeds, trade messages, and news streams to confirm they arrive on time, in the right order, and without gaps or corruption. Think of it as the pulse check of your entire trading operation. If the heartbeat skips, you need to know instantly, not after the fact.
This is not the same as simply glancing at a dashboard once an hour. True monitoring tracks several distinct quality dimensions simultaneously:
- Latency: How long does it take for a market event to travel from the source exchange to your system? Even a few milliseconds can matter in fast markets.
- Completeness: Are all expected messages arriving? Sequence gaps, even tiny ones, can mean you missed a trade print or a quote update.
- Freshness: Is the data current? A feed that stops updating is still “connected” in a technical sense but delivers stale information that can mislead you.
- Availability: Is the feed up at all? Data quality metrics like latency percentiles (p50, p95, p99), sequence gaps smaller than 1 in a million, watermark lag, and uptime targets above 99.99% are the benchmarks serious market participants track.
Portfolio outcomes are directly tied to these dimensions. A trader relying on a feed with 200ms of hidden latency during a volatile session may execute at prices that no longer exist. An investor who misses a news feed gap might act on an incomplete earnings report. Setting up real-time alerts for traders is one practical way to make sure you catch these issues the moment they surface.
“Automated, continuous monitoring is not a luxury for high-frequency shops. Any active participant in financial markets needs systems that watch data quality around the clock, because problems do not politely wait for business hours.”
The shift from periodic spot-checks to continuous automated monitoring is the single most important operational upgrade most traders can make. Manual reviews catch yesterday’s problems. Automation catches today’s.
Core components and requirements: What tools and metrics do you need?
Understanding its significance, you will need to assemble the right toolkit and set clear measurement targets before launching or optimizing your monitoring setup. The components fall into three broad categories: collection agents, measurement tools, and alerting systems.
| Component | Function | Key metric tracked |
|---|---|---|
| Synthetic probes | Send test messages to simulate real feed behavior | Round-trip latency, availability |
| Passive listeners | Tap into live feeds without disrupting them | Sequence completeness, out-of-order messages |
| Reconciliation systems | Compare feeds from multiple vendors | Cross-vendor consistency, price discrepancies |
| Freshness monitors | Track last-update timestamps against expected intervals | Watermark lag, stale data windows |
| Uptime trackers | Log feed connection and disconnection events | Availability percentage, downtime duration |
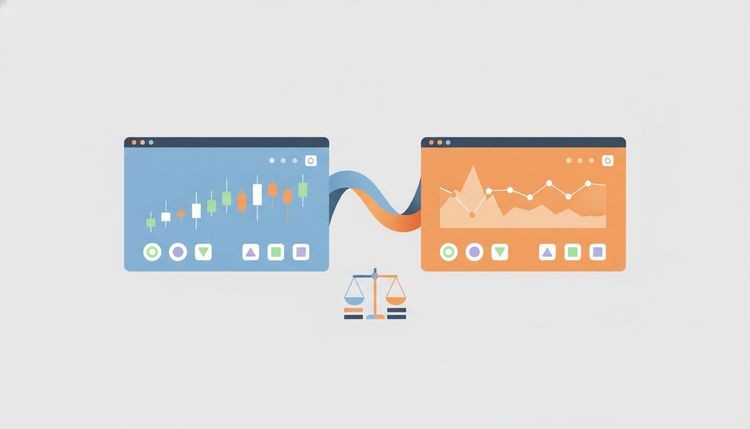
Continuous automated monitoring with real-time alerts consistently outperforms manual checks for a straightforward reason: markets never pause. A reconciliation system running in the background can compare your primary vendor feed against a secondary source every second. A human analyst reviewing logs each morning simply cannot match that coverage. The real-time market data guide and broader resources on market fluctuation analysis offer additional context on building out this infrastructure.
Your must-have monitoring components, at minimum, include:
- Latency trackers measuring p50, p95, and p99 delivery times against your defined SLAs
- Sequence checkers flagging gaps in message numbering that indicate missing data
- Freshness indicators alerting when a feed has not updated within its expected interval
- Uptime monitors confirming feeds are live and connected during all trading sessions
Pro Tip: Set threshold-based notifications tied directly to your service level agreements (SLAs). If your vendor promises p99 latency under 10ms, configure your alert to fire when you see even two or three consecutive readings above that threshold, not just when averages spike.
Step-by-step: How to implement effective market data monitoring
Once you have gathered the requirements, following an organized process is essential to ensure everything works seamlessly. Here is a practical sequence for getting your monitoring system operational.
- Define your quality goals. Before installing any tool, document your acceptable ranges for latency, completeness, freshness, and availability. These become your SLA baselines. For example, you might require p99 latency under 15ms, sequence gap rates below 1 in a million, and 99.95% uptime per session.
- Select your monitoring approaches. You have three primary methodologies to work with, and most robust setups combine all three. Key approaches include synthetic probes, passive listeners, cross-vendor reconciliation, and timestamp validation using dual timestamps (source event time and receive time) to detect stale data.
- Deploy monitoring agents. Place synthetic probes at the boundary points where feeds enter your infrastructure. Configure passive listeners on the main data buses inside your systems. Connect your reconciliation engine to at least two independent vendor feeds covering the same instruments.
- Configure alerts and escalation paths. Alerts should route to the right person or system immediately. A latency spike during pre-market hours needs a different response than one at 3:45 PM on a high-volume day.
- Test the entire pipeline before going live. Simulate known failure modes: cut a feed, introduce artificial latency, inject a duplicate message. Verify that your alerts fire correctly and your team knows how to respond.
- Document and review regularly. Your first configuration will not be your best. Market structure changes, new instruments are added, and vendor behavior evolves. Build review cycles into your process.
| Method | Strengths | Limitations |
|---|---|---|
| Synthetic probes | Proactive, catches latency and availability before real data is affected | Artificial traffic, may not reflect all real-world conditions |
| Passive monitoring | Non-intrusive, operates on live data | Reactive, only detects issues after they occur in real feeds |
| Cross-vendor reconciliation | Catches discrepancies neither vendor alone would flag | Requires two feeds, adds infrastructure cost |
For deeper context on how live price feeds interact with monitoring infrastructure, the guide on tracking live market prices is worth reviewing. For broader architectural thinking, resources on data integration best practices provide a useful framework.
Pro Tip: Periodically cross-check vendor feeds for consistency even when alerts are quiet. Silent periods are exactly when subtle drift accumulates. A weekly manual reconciliation review, even with automation running, adds a valuable human layer.
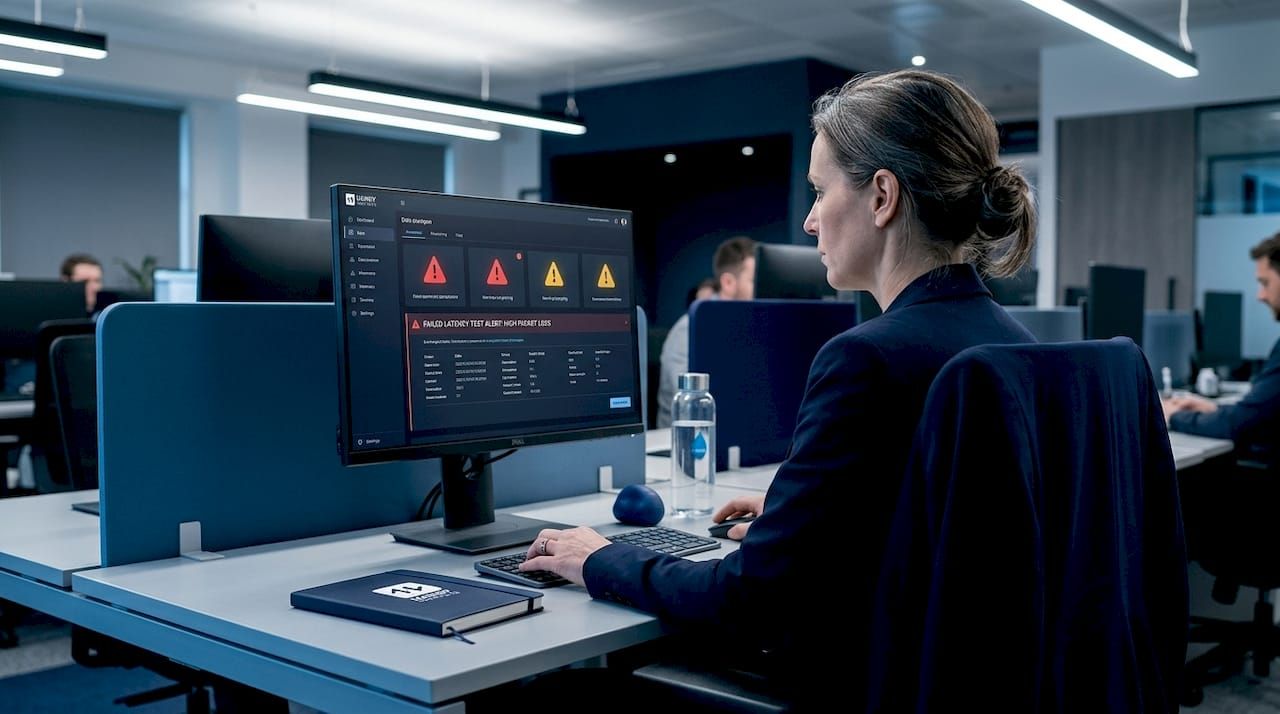
Verifying results: Detecting, diagnosing, and correcting data anomalies
With a process in place, you need to ensure ongoing integrity and address issues as they arise. Monitoring alerts are only valuable if you know what they mean and how to act on each type.
Common alert types and what they typically signal:
- Latency spikes: Usually indicate network congestion, vendor infrastructure load, or a routing change. Check if the spike is isolated to one symbol group or affects the entire feed.
- Sequence gaps: Often mean messages were dropped in transit. Determine whether the gap can be backfilled or whether the data is simply lost.
- Duplicate messages: Can cause double-counting in position calculations. Trace them to whether they originate at the source or within your own processing pipeline.
- Out-of-order messages: May indicate clock synchronization issues between your system and the data source, or a buffer overflow in the feed handler.
- Stale timestamps: The most dangerous anomaly type, because the feed looks alive but is serving old data. This is where dual timestamp tracking earns its value immediately.
Modern anomaly detection operates across three tiers, and understanding each helps you choose the right level for your setup. Rule-based approaches fire alerts when predefined thresholds are crossed, simple to configure and highly reliable for known failure patterns. Statistical methods like Z-scores and peer comparisons catch unusual deviations from normal behavior even when no explicit rule is violated. Machine learning approaches identify complex patterns and novel anomaly types that rules and statistics might miss. Regulatory surveillance uses all three layers, combining rule-based, statistical, and ML methods for manipulation detection, and sophisticated market participants are increasingly borrowing the same framework.
“Data quality degrades silently through schema drift, duplicates, and message loss. Continuous automated monitoring with alerts tied to SLAs is essential, because periodic checks will always lag too far behind to protect you.”
The risk of relying on periodic manual reviews is real and measurable. A feed that starts delivering 50ms higher latency at 9:35 AM every session may not appear in a daily summary log as a dramatic event, yet it consistently costs you edge on open orders. Automation catches the pattern; manual review rarely does. Resources on reducing finance errors show how automation-first approaches reduce costly mistakes across financial operations more broadly.
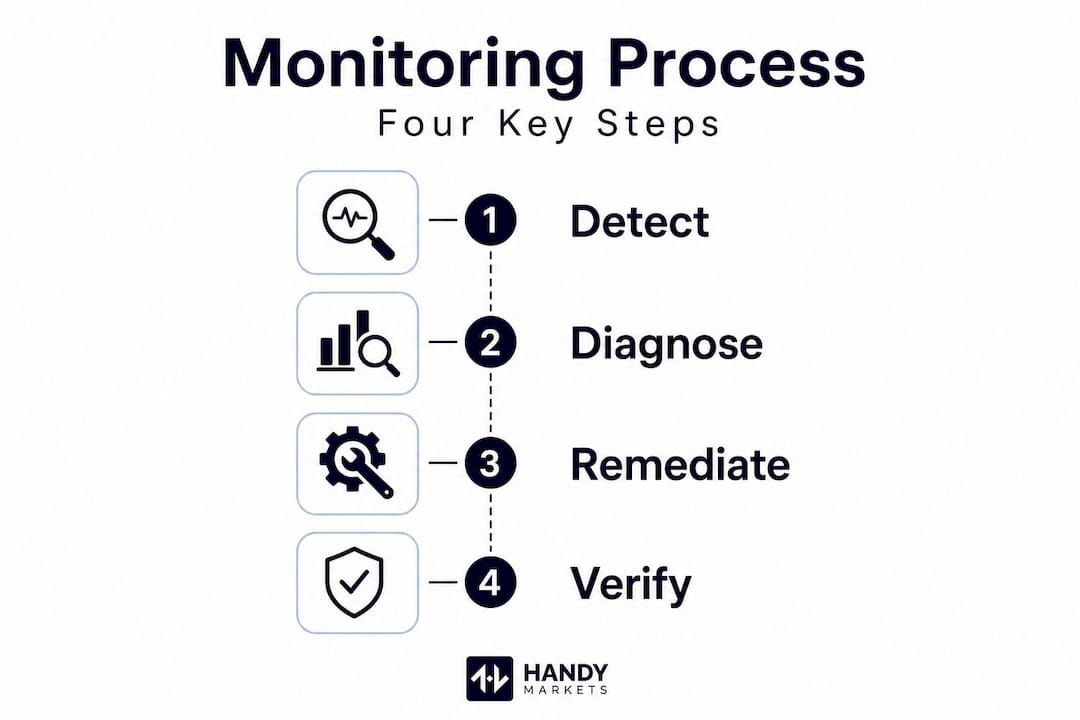
Correcting anomalies follows a consistent three-step loop: detect, diagnose, and remediate. Detection fires the alert. Diagnosis traces the issue to its source, whether that is the vendor, your internal network, or your processing layer. Remediation may mean switching to a backup feed, requesting a replay from the vendor, or adjusting your internal buffer settings. Comparing your monitoring results against financial markets data across asset classes helps identify whether an anomaly is isolated to one market or part of a broader systemic event. Staying current with market data trends in 2026 also ensures your anomaly detection rules stay calibrated to evolving feed architectures.
Our take on market data monitoring: What most guides miss
Most articles on market data monitoring treat it as a purely technical problem. Configure your tools, set your thresholds, and move on. We think that framing misses the most important dimension: the strategic mindset that keeps your monitoring actually effective over time.
Here is what we observe consistently. Even experienced traders who invest in excellent monitoring infrastructure underestimate silent failures. Not every data quality problem triggers an alert, and the reason is almost always that the SLAs and thresholds were configured once and never revisited. Markets evolve. New asset classes are added. Vendor feed architectures change after upgrades. A threshold that was appropriately tight in January may be dangerously loose by September.
Manual dashboard glances give you a false sense of security. You see green indicators and assume everything is fine, but those indicators only reflect the rules you wrote months ago. Reviewing your market volatility checklist periodically reminds you that market conditions themselves shift the baseline for what “normal” latency looks like.
The real edge comes not from setting up monitoring once but from building a culture of adaptive monitoring. That means scheduling quarterly reviews of your alert thresholds, logging every anomaly even when it seems minor, and building a database of root causes so you can spot recurring patterns. A feed that drops five messages on the third Friday of each month is not random noise. It is a solvable problem once you have the data to see it.
We also think the human-automation balance deserves more nuance than most guides give it. Automation handles the continuous watching. Humans handle the interpretation, the judgment calls, and the threshold refinement. Neither works well without the other. The traders and investors who build durable monitoring processes treat their anomaly logs the way a pilot treats a flight log: every entry is a learning opportunity, not just a record of past events.
Take your market data monitoring to the next level
Now that you understand the essentials, tap into modern solutions to automate and simplify your market data monitoring. Building robust monitoring from scratch is achievable, but having the right platform as your foundation makes every step faster and more reliable.
Handy.markets brings real-time prices, percentage changes, and live data together across cryptocurrencies, stocks, commodities, indices, and forex in one streamlined view. You can personalize your asset coverage and, critically, set up price alerts across Telegram, Discord, Slack, SMS, Webhook, and Email in just minutes. Whether you are watching for a breakout in a tech stock or monitoring a crypto pair during a volatile session, custom alerts ensure you never miss a critical market movement. Use Handy.markets as the real-time intelligence layer your monitoring process deserves.
FAQ
Which metrics are most important in market data monitoring?
The key metrics are latency, message completeness, data freshness, and availability, as these ensure you receive accurate and timely feeds. Specifically, robust monitoring tracks latency at p50, p95, and p99 percentiles, sequence gaps below 1 in a million, watermark lag, and uptime above 99.99%.
How do I detect silent failures or data quality issues?
Automated, continuous monitoring with customized alerts is essential to catch issues like schema drift or message duplication before they impact your trades. Data quality degrades silently, making periodic manual checks insufficient for reliable protection.
What are the main techniques for monitoring market data feeds?
Effective methods include using synthetic probes, passive listeners, dual timestamp validation, and cross-vendor reconciliation. These methodologies together provide layered coverage that no single approach achieves on its own.
How do regulators monitor for market manipulation in trade data?
They use rule-based, statistical, and machine learning methods to detect unusual patterns and possible manipulation in market data. Regulatory surveillance specifically combines Z-scores, peer comparisons, anomaly detection models, and graph analysis to identify suspicious activity.