TL;DR:
- Choosing the correct market data level depends on trading style and complexity needs.
- Raw feeds offer low latency but require technical infrastructure, while packaged data is suitable for retail traders.
- Most traders succeed by mastering existing data tools before upgrading to more advanced or granular sources.
Choosing the right market data can feel like standing in front of a wall of switches with no labels. Too little information and you’re trading blind. Too much, and you’re drowning in noise that slows your decisions rather than sharpening them. Whether you’re tracking Bitcoin, S&P 500 futures, or crude oil, the data feeding your analysis is either giving you an edge or holding you back. This article breaks down every major type of market data, from depth levels to delivery methods, so you can match the right tools to your specific trading goals and stop leaving performance on the table.
Table of Contents
- Understanding market data by depth: Level 1, 2, and 3
- Processing methods: Raw, normalized, and packaged data
- Types by information: Reference, pricing, analytics, and more
- How market data is delivered: Channels, hardware, and licensing
- What most traders miss about choosing market data
- Upgrade your market data edge with Handy.Markets
- Frequently asked questions
Key Takeaways
| Point | Details |
|---|---|
| Market data depth explained | Choose the right level (1, 2, or 3) based on your trading needs and technical setup. |
| Processing format matters | Raw, normalized, and packaged data each offer distinct advantages for various strategies. |
| Blending data categories | Combining reference, analytical, and technical data leads to stronger decisions. |
| Access requires planning | Delivery methods, fees, and hardware impact what types of data you can realistically use. |
Understanding market data by depth: Level 1, 2, and 3
Now that you know the importance of choosing the right data, let’s start with the foundational division: depth levels. Primary types of market data fall into three distinct tiers, each revealing progressively more about what’s happening in a market at any given moment.
Level 1 is what most retail traders see every day. It shows the best bid price, the best ask price, the last traded price, and total volume. Think of it as the front window of a market: clean, simple, and sufficient for most decision-making needs. If you’re swing trading stocks or monitoring crypto spot prices, Level 1 is often all you need.
Level 2 opens the curtain wider. It displays the full order book, showing multiple price levels on both the buy and sell sides, along with the size of orders sitting at each level. This is extremely useful when you want to gauge where large buyers or sellers are positioned. An active day trader watching a stock break through resistance, for example, can use Level 2 data to see whether real demand backs the move or whether it’s thin and likely to reverse.
Level 3 is the most granular tier available. It shows every individual order in the queue, including order IDs and exact queue position. This level of detail, explained thoroughly in the advanced order book explanation, is primarily used by high-frequency trading firms and algorithmic desks. For most traders, it’s overkill, and in crypto markets, L3 data can even expose front-running risk by revealing order intent too clearly.
When comparing financial market categories across asset classes, the significance of each depth level shifts depending on market structure.
| Level | Data provided | Best use case |
|---|---|---|
| Level 1 | Best bid/ask, last price, volume | Retail trading, long-term investing |
| Level 2 | Full order book by price level | Active day trading, market depth analysis |
| Level 3 | Individual orders, queue position | HFT, algorithmic execution |
- Level 1: Ideal for most traders and investors
- Level 2: Adds meaningful edge for active participants
- Level 3: Reserved for institutions with specialized infrastructure
Pro Tip: Level 2 data often gives enough edge for active traders without the operational complexity and cost of Level 3. Pair it with real-time monitoring insights to act on depth signals quickly.
Processing methods: Raw, normalized, and packaged data
Having covered how data is structured by depth, the next key factor is how it’s processed and delivered. Market data formats span three main processing types, each with its own speed profile, flexibility, and ideal user.
Raw data is the unfiltered tick-by-tick stream directly from an exchange. Nothing is modified, cleaned, or aggregated. Every single order event arrives in sequence. This format offers near-zero latency, which is exactly why high-frequency trading firms demand it. The downside is complexity: raw feeds require significant technical infrastructure to consume, store, and interpret.

Normalized data is raw data that has been standardized across multiple exchanges or asset classes. When you want to compare the bid/ask spread of Bitcoin on Binance with the same metric on Coinbase, normalized data handles the translation between different data schemas automatically. Platform developers, portfolio managers, and multi-asset allocators rely heavily on this format. It’s the backbone of real-time data explained in a cross-market context.
Packaged data takes normalized data further by layering in analytics, summaries, and pre-built indicators. Think charting platforms, broker dashboards, and mobile trading apps. The tradeoff is a slight delay and sometimes a reduction in granularity, but the accessibility makes it the right fit for the majority of retail traders.
Here’s how the three processing methods stack up:
| Processing method | Speed | Flexibility | Best user profile |
|---|---|---|---|
| Raw | Ultra-low latency | Maximum | HFT, quant firms |
| Normalized | Low latency | High | Platform developers, allocators |
| Packaged | Moderate | Lower | Retail traders, mobile users |
Knowing when to upgrade from packaged to normalized or raw matters more than most traders realize. Consider upgrading when:
- Your strategy depends on sub-second execution timing
- You’re trading across three or more asset classes simultaneously
- You’re building or integrating your own algorithmic system
- Packaged data delays are causing consistent slippage in your results
For context on where these formats are heading, exploring data format trends gives you a forward-looking perspective that shapes how you build your toolkit today.
Types by information: Reference, pricing, analytics, and more
With structure and processing covered, let’s turn to the main informational divisions you’ll encounter. Market data isn’t just numbers on a screen. It comes in distinct informational categories, and each one serves a different role in your research and execution.
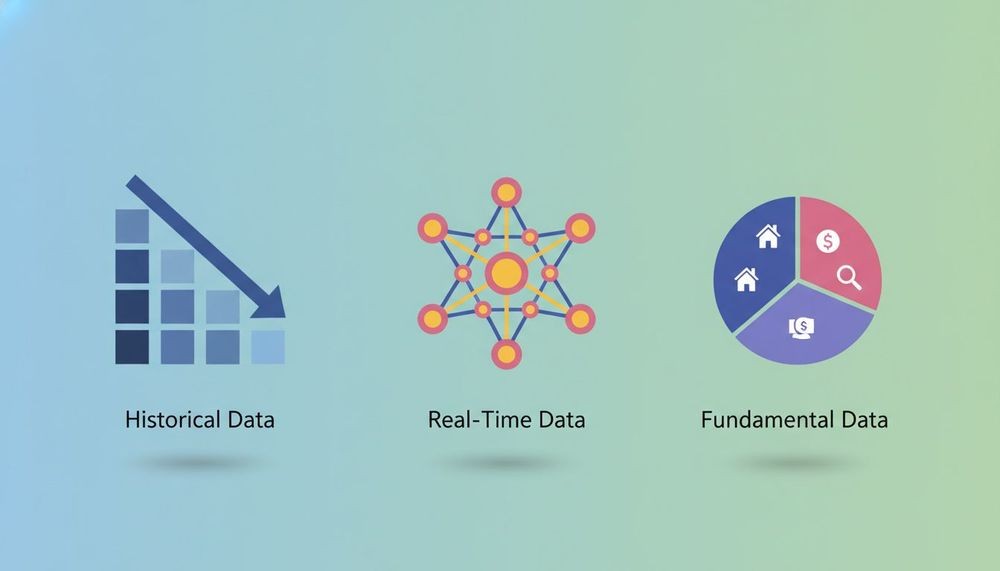
Instrument reference data, pricing, analytics, and fundamental data each form a unique layer in a trader’s information stack. Here’s how they break down in practice:
- Reference data: Instrument identifiers like ISIN and CUSIP codes, corporate actions such as stock splits and dividend announcements. Critical for automation and backtesting accuracy.
- Pricing data: Evaluated prices for illiquid assets (like certain bonds or OTC instruments) where no live market quote exists. Often derived from models.
- Analytics data: Option Greeks (Delta, Gamma, Theta, Vega), volatility surfaces, and implied volatility metrics. Useful for any options or derivatives trader.
- Fundamental data: Earnings per share, price-to-earnings ratios, revenue growth, and balance sheet metrics. Helps align trade timing with business reality.
- Technical data: Open, High, Low, Close (OHLC) bars, moving averages, RSI, and MACD. The language of chart-based trading strategies.
For anyone using indicators for technical analysis, technical data is the starting point. But combining it with fundamental signals adds a layer of conviction that purely chart-based signals can’t deliver alone.
Reference data is the silent foundation of every algorithmic system. Without accurate instrument identifiers and corporate action records, backtests produce misleading results and live systems misfire on execution.
Pro Tip: Blending technical data with fundamental signals sharpens both entry timing and trade confidence. A stock showing a bullish breakout on charts carries far more weight when earnings momentum supports it too. Pair your analysis strategies with advanced analysis techniques to build a multi-dimensional view.
How market data is delivered: Channels, hardware, and licensing
It’s not just about what data you use, but also how you access it. Let’s dig into delivery and compliance, because the infrastructure behind your data feed shapes what you can do with it.
Market data is delivered via multicast, WebSockets and APIs, or direct exchange feeds, each with distinct characteristics:
- Multicast: Broadcast delivery optimized for raw speed. Used by institutional players who need simultaneous data across thousands of instruments with minimal latency.
- WebSockets and APIs: The most common delivery method for normalized and packaged data. REST APIs work for lower-frequency polling; WebSockets push live updates without refresh cycles.
- Direct exchange feeds: Proprietary feeds sold by exchanges directly. Offer the freshest data but require licensing agreements and often co-location arrangements.
Advanced delivery for Level 3 data or raw institutional feeds requires specialized hardware. FPGA (Field-Programmable Gate Array) cards process data at the hardware level, shaving microseconds off latency. Co-location services place your servers physically inside an exchange’s data center. KDB+ databases are commonly used to store and query massive tick datasets.
Licensing is a frequently overlooked detail. Exchanges distinguish between professional and non-professional users, and the fee difference can be dramatic. Non-display use (algorithmic trading or risk calculations) is licensed differently than display use (showing prices on a screen). If you’re using live price strategies for systematic execution, you may need to review your data license terms carefully.
Steps to access more advanced data feeds without overpaying:
- Start with your broker’s built-in Level 2 feed before paying for a third-party source
- Confirm whether you qualify as a non-professional user to reduce licensing costs significantly
- Evaluate latency requirements. If you’re not trading in milliseconds, WebSocket APIs are sufficient
- Test normalized feeds from aggregators before committing to raw exchange feeds
- Reassess your data tier quarterly as your strategy evolves
What most traders miss about choosing market data
Here’s a truth we’ve observed repeatedly: traders often upgrade to Level 3 or raw feeds hoping the data itself will make them more profitable. It rarely works that way. The complexity and cost of advanced feeds can actually hurt performance if your process isn’t already solid. You end up managing infrastructure instead of managing trades.
The smarter approach is to master what you have first. Level 1 and Level 2 data, paired with good packaged or normalized feeds, is enough to build a profitable system. Only when your results are consistent and your bottleneck is genuinely the data should you consider upgrading. Watching changing market data needs evolve over time helps you identify the right moment to scale up without jumping ahead of your readiness.
Retail trading success is far more about process and discipline than chasing the most granular feed available. As we see it: “The sharpest edge in trading isn’t always about more data, but better questions.”
Upgrade your market data edge with Handy.Markets
Ready to put these insights to work for your trading? Handy.Markets brings together the key market data elements we’ve discussed, without the complexity or overhead.
Whether you’re monitoring crypto, stocks, commodities, or forex, you can access live prices and percentage changes across all major asset classes in one place. Set up price alerts across Telegram, Discord, Slack, SMS, and email in minutes, so critical market moves never slip past you. Browse full cryptocurrency data with real-time updates, or use the all-in-one market monitoring dashboard to personalize your entire watchlist. Your data toolkit just got a practical home base.
FAQ
What is the difference between Level 1, Level 2, and Level 3 market data?
Level 1, 2, and 3 data differ by depth: Level 1 shows the best bid/ask and last trade, Level 2 reveals the full order book across multiple price levels, and Level 3 exposes every individual order and its queue position.
When should I use raw versus packaged market data?
Raw data suits HFT and algorithmic trading where latency is critical, while packaged data works best for most retail traders who benefit from built-in analytics and simplified interfaces.
What are examples of reference and analytical market data?
Reference data includes ISINs and corporate actions like dividends or stock splits, while analytical data covers option Greeks, implied volatility surfaces, and quantitative risk indicators.
How is market data delivered to trading platforms?
Data is delivered via multicast, WebSockets and APIs, or direct exchange feeds, with the right choice depending on how fast your strategy needs information to arrive.