TL;DR:
- Effective market analysis in 2026 requires combining macroeconomic insights with technical indicators.
- Traders prioritize RSI, MACD, and Bollinger Bands, especially when aligned with macro signals.
- Flexibility and timely updates of indicator tools are essential due to rapidly shifting markets.
Picking the right market indicators in 2026 feels like finding a signal in a storm. With geopolitical tensions, AI disruption, and global GDP growth projected at 3.1% for the year, every data point carries higher stakes. Traders scanning dozens of signals daily risk paralysis, while investors who ignore macro shifts risk being blindsided. This guide cuts through the noise by laying out a clear, evidence-backed framework that bridges technical analysis and macroeconomic context, giving you the tools to make sharper, more confident decisions across any asset class.
Table of Contents
- Key criteria for selecting market indicators in 2026
- Top technical indicators traders use in 2026
- Top macroeconomic indicators for investors in 2026
- Comparing macro and technical indicators: When to use each
- Why adaptation outperforms indicator loyalty in 2026
- Take the next step: Put market indicators into action
- Frequently asked questions
Key Takeaways
| Point | Details |
|---|---|
| Blend indicator types | Combining technical and macro indicators yields stronger market insights in 2026. |
| Adapt to the market | Re-evaluate your indicators regularly to match changing conditions and risks. |
| No universal best | The most effective indicator depends on your strategy, asset class, and timeframe. |
| Leverage real-time tools | Use modern platforms to track, alert, and act quickly on chosen market signals. |
Key criteria for selecting market indicators in 2026
To make sense of what comes next, it’s crucial to set a strong evaluation framework. Not every indicator earns a place in your strategy, and in 2026, the selection process matters more than ever. Markets are pulsing with opportunities and risks shaped by geopolitical conflict, tightening monetary policy, and AI-driven volatility patterns that older models simply weren’t built to capture.
When evaluating any indicator, consider these core criteria:
- Relevance: Does the indicator directly reflect current market conditions, including AI-driven price action and geopolitical risk premiums?
- Timeliness: Leading indicators give advance signals, while lagging indicators confirm trends after they form. You need both.
- Reliability: How often has the indicator produced accurate signals in similar market environments?
- Adaptability: Can the indicator work across asset classes, including crypto, equities, commodities, and forex?
- Data quality: Is the underlying data clean, frequent, and trustworthy?
Context is everything. Macro signals from the IMF point to GDP growth, inflation, and capital flows as the top investor-level metrics for 2026, while technical communities favor RSI, MACD, and Bollinger Bands for short-term trading precision. Neither school is wrong. They serve different masters.
“No single indicator is universally best. The most effective traders and investors treat their indicator set as a living toolkit, not a fixed formula.”
Blending technical signals with macro context gives you a more complete picture. For example, a bullish MACD crossover means a lot more when GDP growth is stable than when global trade is contracting. You can explore how these dynamics are playing out with 2026 stock market trends and align your picks with proven investment strategies for 2026.
Pro Tip: Always cross-check at least one leading indicator against one lagging metric before acting on a signal. If they disagree, wait for confirmation rather than forcing a trade.
Top technical indicators traders use in 2026
Understanding which criteria are foundational, we can explore the most widely used technical indicators among traders. Technical analysis remains the heartbeat of active trading, and in 2026, three tools dominate the conversation.
RSI (Relative Strength Index) measures the speed and magnitude of recent price changes on a scale of 0 to 100. Readings above 70 signal overbought conditions, while readings below 30 indicate oversold territory. RSI is especially useful in sideways markets where trend-following tools give false signals.
- Strengths: Fast, visual, works across all asset classes
- Weaknesses: Can stay in overbought/oversold zones for extended periods during strong trends
MACD (Moving Average Convergence Divergence) tracks the relationship between two exponential moving averages, usually the 12-day and 26-day. A bullish signal fires when the MACD line crosses above its signal line. Traders love it for trend confirmation.
- Strengths: Excellent for catching momentum shifts early
- Weaknesses: Lags in fast-moving, news-driven markets
Bollinger Bands plot two standard deviations above and below a moving average. When price touches the upper band, the asset may be overextended. When it touches the lower band, a reversal is possible. The bands also widen during volatility spikes, making them a useful real-time gauge of market stress.
- Strengths: Adapts dynamically to volatility, great for spotting reversals
- Weaknesses: Not ideal as a standalone entry signal
AI-powered screening tools now scan thousands of assets in real time, flagging when RSI, MACD, and Bollinger Bands align simultaneously. That convergence often marks high-probability setups. You can get a deeper look at these tools through this guide to essential market indicators and stay current with market data trends for traders.
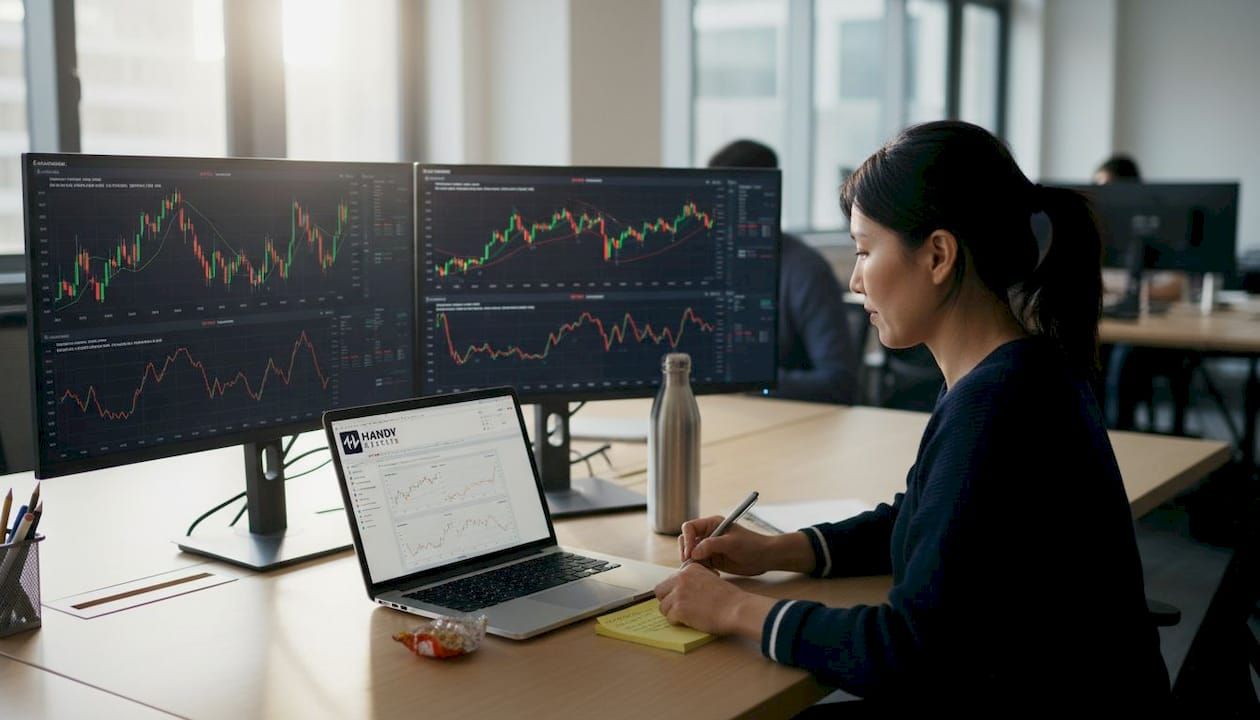
Pro Tip: Combine RSI with Bollinger Bands when trading volatile assets. When RSI is oversold and price touches the lower Bollinger Band simultaneously, the probability of a reversal jumps significantly compared to either signal alone.
Top macroeconomic indicators for investors in 2026
While technical tools are essential for traders, long-term investors look first to macroeconomic signals. Macro indicators describe the health of entire economies, and in 2026, that health is under real pressure.
The IMF projects global GDP growth at 3.1% for the year, a figure dampened by ongoing Middle East conflict and persistent trade friction. That slowdown compresses corporate earnings expectations globally and pushes investors toward defensive asset classes.
Key macro indicators to monitor right now include:
- GDP growth rates: Slowing growth signals caution for cyclical equities and risk assets
- Inflation readings (CPI and PCE): Modestly rising inflation in 2026 affects bond yields and real returns
- Central bank policy rates: Fed and ECB decisions ripple across currencies, equities, and commodities
- Purchasing Managers Index (PMI): A PMI above 50 signals expansion; below 50 signals contraction
- Capital flows: Where institutional money moves reveals sector and regional conviction
Key stat: The IMF’s 3.1% global GDP growth forecast for 2026 represents a meaningful deceleration from previous years, driven in part by geopolitical shock and tightening financial conditions.
Inflation deserves special attention. Rising consumer prices erode fixed income returns, push gold and commodities higher, and force central banks to hold rates elevated longer. Investors who track inflation-adjusted returns, not just nominal figures, make sharper allocation calls.
Macro and technical indicators interact in ways that matter. A PMI collapse often precedes a sustained equity selloff, which you’ll then see reflected in MACD crossovers and RSI readings weeks later. Using advanced market analysis techniques helps you spot these connections before they fully play out.
Comparing macro and technical indicators: When to use each
Armed with a breakdown of both schools, it’s time to compare their effectiveness head-to-head. The choice between macro and technical indicators isn’t an either/or decision; it’s a matter of timing, strategy, and context.
| Factor | Macro indicators | Technical indicators |
|---|---|---|
| Time frame | Long-term (months to years) | Short-term (minutes to weeks) |
| Best for | Portfolio allocation, sector rotation | Entry and exit timing, trade signals |
| Data source | Government reports, IMF, central banks | Price and volume charts |
| Reaction speed | Slow, released periodically | Real-time, continuous |
| Ideal user | Long-term investors, fund managers | Active traders, swing traders |
| Weakness | Lags real-time price action | Misses structural economic shifts |
As context, asset class, and market conditions determine which indicator delivers value, neither approach dominates universally. The real skill is knowing when to lean on each.
Here’s a practical process to blend both for well-rounded analysis:
- Start with macro context. Before reviewing any chart, know the current GDP trend, inflation direction, and central bank stance. This sets the bias for your trades.
- Identify the asset class. Macro signals matter more for bonds and large-cap equities. Technical signals matter more for crypto, forex, and small-cap stocks.
- Select 2 to 3 technical indicators that suit the asset’s volatility profile and your time frame.
- Check for alignment. If macro signals and technical signals point the same direction, conviction is higher. If they conflict, reduce position size.
- Set a review trigger. Define what data release or price level would cause you to reassess your view.
Relying only on technicals during a macroeconomic shock is one of the most common and costly mistakes traders make. Likewise, macro-only investors often miss optimal entry and exit points worth significant return. Explore proven trading strategies that integrate both for a more resilient approach.
Why adaptation outperforms indicator loyalty in 2026
Seeing how the two approaches stack up lays the groundwork for a more flexible strategy. Here’s our honest take: the traders and investors who struggle most in 2026 aren’t the ones using the wrong indicators. They’re the ones refusing to update the ones they use.
Markets in 2026 shift faster than any fixed toolkit can keep up with. AI-driven flows can invalidate a classic RSI setup in hours. A geopolitical headline can render a bullish MACD crossover meaningless before the trade settles. The most effective professionals we’ve observed update their indicator mix every quarter, sometimes more often, based on what the current environment is actually rewarding.
Dogmatism around any single indicator is a form of market arrogance. The market doesn’t care about your favorite tool. It rewards those who listen carefully and adjust quickly. Build flexibility into your process from the start, and your results will reflect it.
Take the next step: Put market indicators into action
The right approach starts with agility, and your next move is to put this knowledge to work.
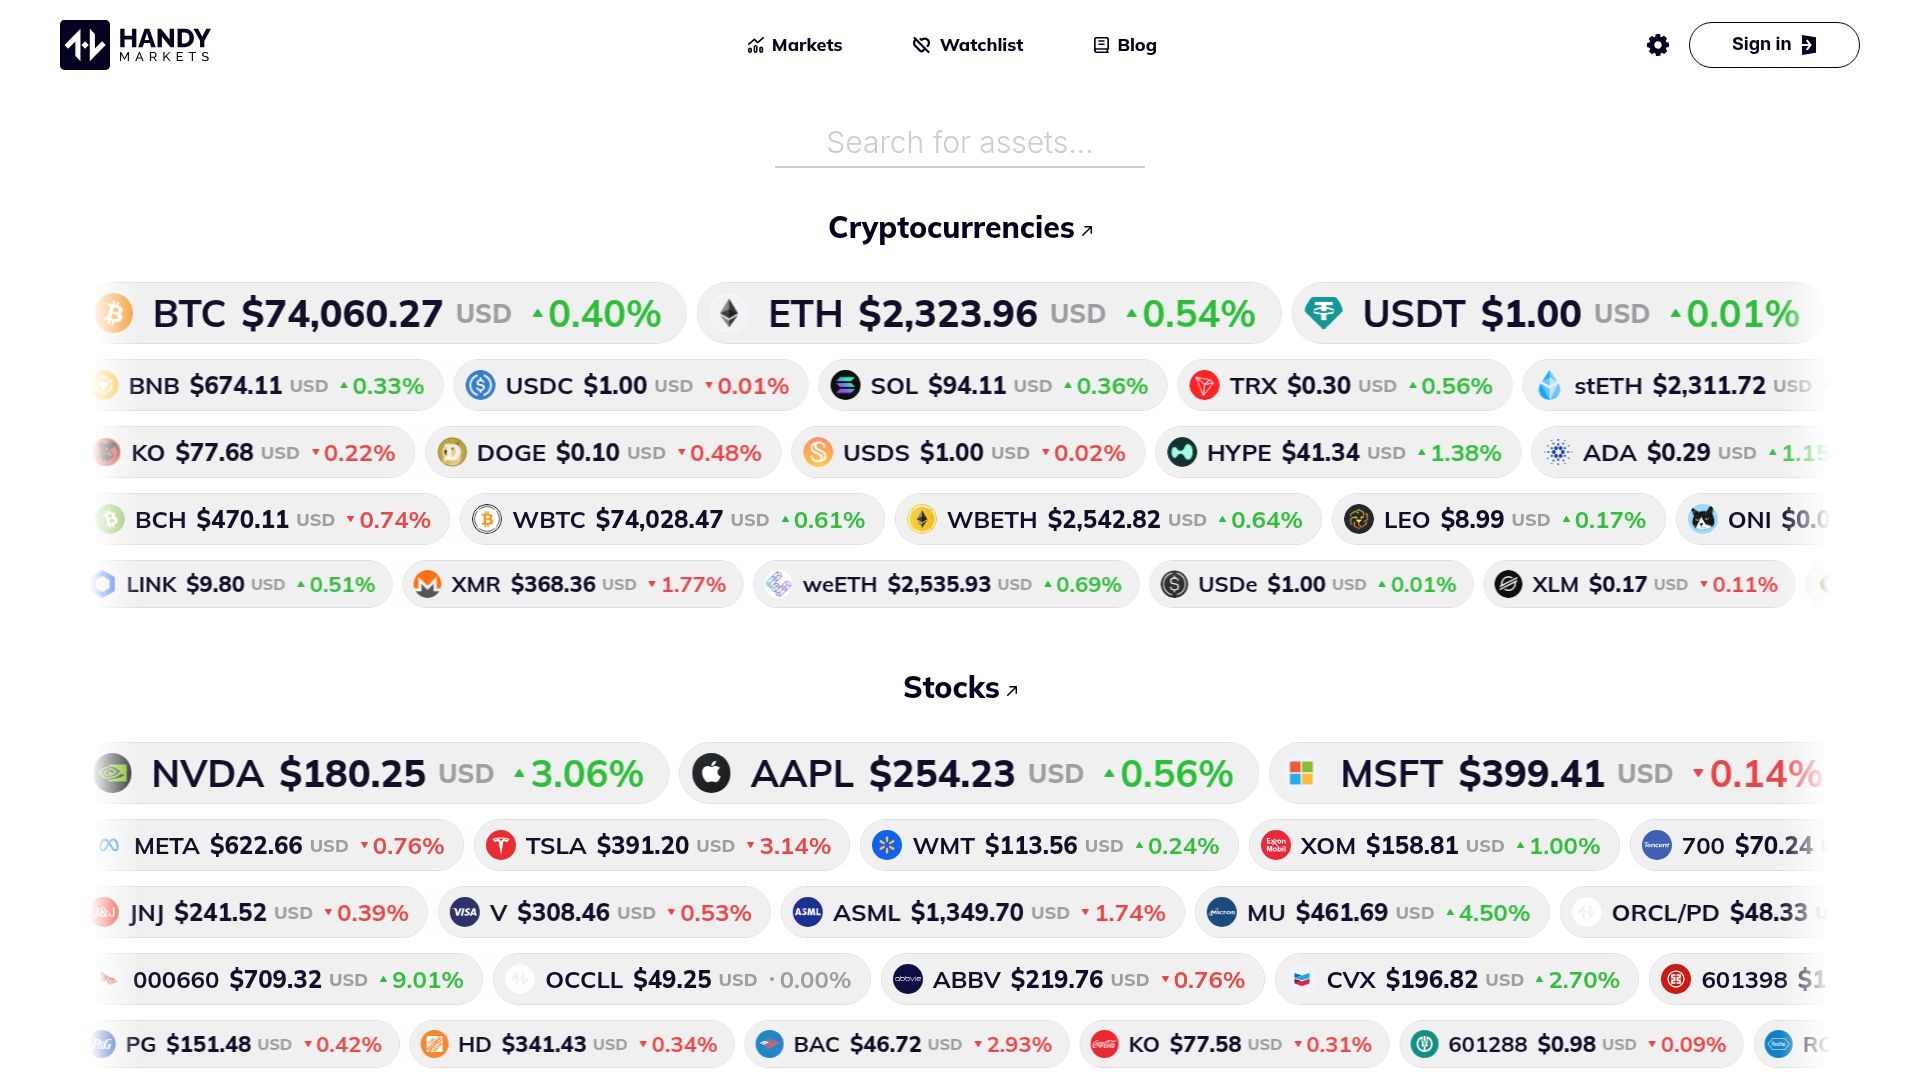
At Handy.markets, we make it easy to monitor the indicators that matter most to you across stocks, crypto, commodities, forex, and more, all in one place. You can set up price alerts in minutes across Telegram, Discord, Slack, SMS, Email, and Webhook, so you’re notified the moment key levels are hit. Whether you’re tracking RSI breakouts, watching GDP-linked equity moves, or monitoring commodity volatility, Handy.markets gives you real-time data and flexible alerts to act decisively, not reactively. Stop guessing and start monitoring with clarity.
FAQ
What is the most important market indicator in 2026?
There is no single best indicator in 2026; the best choice depends on your strategy, time frame, and asset class. Combining macro and technical signals consistently outperforms relying on either alone.
How has the Middle East war influenced key market indicators for 2026?
Geopolitical tensions have pushed global GDP growth down to 3.1% while raising inflation risk, making macro indicators significantly more valuable for portfolio-level decisions this year.
What technical indicator is most suited for volatile 2026 markets?
RSI and Bollinger Bands are favored for spotting reversal points in volatile conditions, but top trading tools work best when combined rather than used in isolation.
How often should I review my indicator strategy in 2026?
You should reassess your indicator mix at least every quarter to stay aligned with shifting market conditions, and more often during periods of elevated geopolitical or economic uncertainty.
Do AI and automation play a role in market indicator selection for 2026?
Yes, AI tools now help traders and analysts rapidly process multi-indicator data across large asset universes, enabling faster and more adaptive decision-making than manual screening allows.