
TL;DR:
- Data is essential in investment journalism because it transforms raw information into verified insights that guide investor decisions. Advances in AI have automated workflows, reducing errors and increasing efficiency, while contextual framing helps readers interpret large figures effectively. The quality and novelty of data are critical, as only unexpected signals influence market movements, emphasizing the importance of source reliability, data vintage, and interpretive skill.
Data is the foundation of investment journalism, converting raw financial information into the precise, actionable signals that drive smarter market decisions. Without structured data, reporters produce opinion. With it, they produce evidence. The role of data in investment journalism has expanded dramatically in 2026, as AI-assisted pipelines, verified datasets from platforms like CEPRES, and full-text databases like SEC EDGAR now define how financial stories are built, verified, and published. Journalists who master data analytics in journalism hold a structural advantage over those who rely on narrative instinct alone. This article explains how that advantage works, where it comes from, and what it means for investors reading the results.
How technology has transformed data-driven investment journalism in 2026
The shift from manual data collection to integrated, automated pipelines is the single biggest change in investment reporting over the past three years. Reporters no longer scrape spreadsheets by hand or copy figures from PDFs. They deploy AI-assisted workflows that handle ingestion, cleaning, and preliminary analysis before a journalist writes a single word.

The clearest example of this shift comes from The Hindu’s newsroom. The publication processed 22 million voter records using OCR and LLM-assisted SQL generation to build election data applications without manual coding. That same architecture now applies directly to financial journalism: large regulatory filings, earnings transcripts, and fund disclosures can be ingested, parsed, and queried at scale. The implication is significant. What once required a data team of five now requires one journalist with the right tools.
Automation also reduces the error rate that has historically plagued financial reporting. Automated data pipelines reduce manual labor by 4 to 8 hours per reporting cycle and accelerate compliance pre-checks by up to 70%. Fewer manual steps mean fewer transcription errors, which matters enormously when a misplaced decimal in a revenue figure can move a stock price.
Here is how a modern investment journalism data workflow typically unfolds:
- Data ingestion: Automated tools pull from SEC EDGAR, Bloomberg feeds, or verified private market platforms on a scheduled or triggered basis.
- Cleaning and normalization: LLMs flag anomalies, standardize date formats, and reconcile conflicting figures across sources.
- Analysis and query: Journalists use natural language prompts to generate SQL queries, surfacing patterns without writing code.
- Visualization prep: Cleaned datasets feed directly into charting tools, reducing the gap between analysis and publication.
- Editorial review: A human journalist interprets outputs, adds context, and makes the final call on what the data actually means.
Pro Tip: Before building any data pipeline for investment reporting, define your resolution rules first. Decide in advance which source wins when two datasets conflict. This single decision prevents hours of downstream confusion and protects editorial credibility.
Why context and framing define the quality of investment reporting
Journalists face a central problem: not a lack of data, but a lack of context. Raw numbers overwhelm readers and can actively mislead them when presented without historical anchors or comparative scale. The importance of data in finance is only realized when that data is framed in a way that investors can interpret and act on.
Reuters visual journalists demonstrated this principle when covering the AI investment surge. To make $1.6 trillion in AI investment comprehensible, they anchored the figure to the Manhattan Project, giving readers a historical reference point that transformed an abstract number into a felt reality. Without that anchor, the figure is just large. With it, readers understand the scale of the commitment and its implications for capital allocation.
Effective contextual framing in investment journalism relies on several specific techniques:
- Scale anchoring: Compare large figures to well-known historical projects, GDP percentages, or per-capita equivalents so readers can calibrate magnitude.
- Trend lines over snapshots: A single quarter’s earnings figure is nearly meaningless. Showing five years of the same metric reveals whether a company is accelerating or decelerating.
- Peer benchmarking: Placing one company’s debt ratio alongside sector medians tells investors whether a risk is idiosyncratic or systemic.
- Visual load reduction: Collaborative work between reporters and visual journalists reduces cognitive load by choosing chart types that match the data’s story, not the designer’s preference.
“The problem isn’t that investors lack data. The problem is that most data arrives without the interpretive layer that turns a number into a decision.” — Storybench, reporting on Reuters’ AI economy visualization project
This is where financial data interpretation becomes a genuine editorial skill, not just a technical one. A journalist who understands how to compare financial markets using anchors and comparative scales produces stories that investors actually use. One who simply publishes raw figures produces noise.
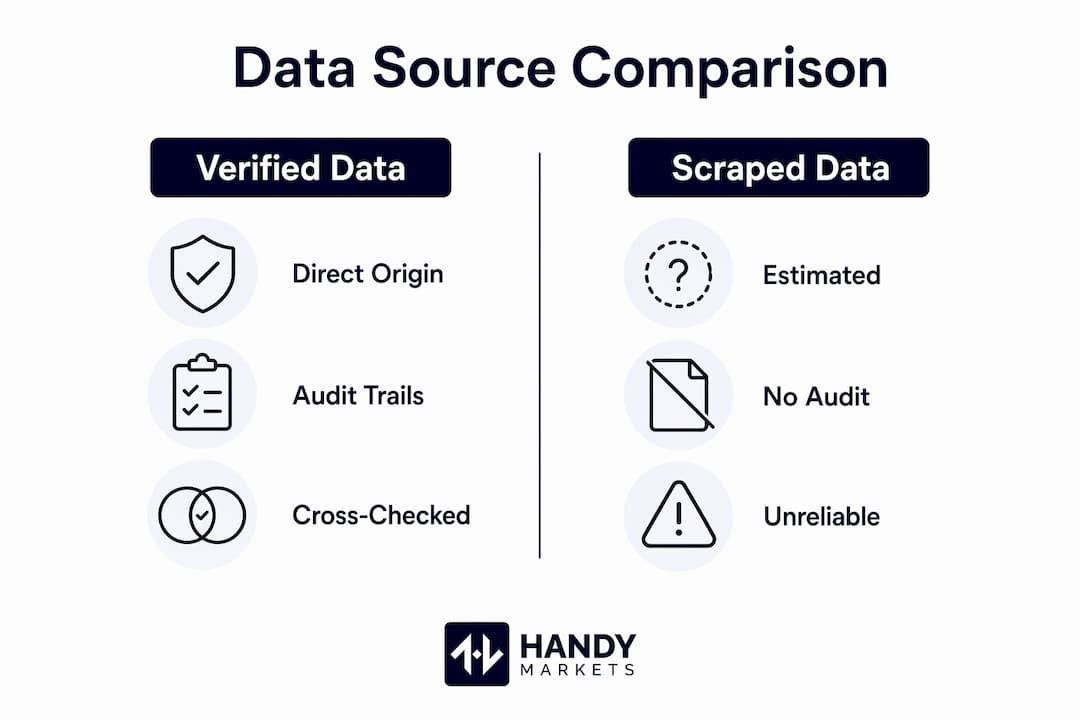
Verified datasets vs. scraped data: what the difference costs you
Not all data sources carry equal weight, and the gap between verified datasets and scraped estimates is wider than most readers assume. The choice of data source is one of the most consequential decisions in investment journalism because it determines whether a story informs or misleads.
| Dimension | Verified platforms (e.g., CEPRES) | Scraped or estimated data |
|---|---|---|
| Data origin | Direct exchange with fund managers and GPs | Aggregated from public filings, estimates, or third-party feeds |
| Accuracy | High; deterministic resolution rules applied | Variable; averaging across conflicting sources introduces error |
| Coverage | 17,200+ funds, 150,000+ deals | Dependent on public disclosure; private markets poorly covered |
| Audit trail | Full lineage and vintage disclosure | Often opaque; collection date unknown |
| Use case | Due diligence, benchmarking, institutional reporting | Trend spotting, preliminary screening |
| Investor trust | High; institutional-grade | Moderate to low for high-stakes decisions |
Editorial standards for investment data require cross-checking key figures with at least two independent public sources and applying deterministic resolution rules rather than averaging when discrepancies appear. Averaging two conflicting figures produces a number that neither source reported, which is a fabrication by another name.
SEC EDGAR provides a critical layer of verification for public company journalism. The database contains over 10 million filings, and disclosure teams use it before drafting to align narratives with peer practices and reduce revision cycles. Journalists who benchmark against EDGAR before publishing reduce the risk of reporting figures that are technically accurate but contextually misleading relative to industry norms. For advanced market analysis techniques, verified fund and deal datasets are the foundation, not an optional upgrade.
How investors actually respond to investment news data
Understanding how markets respond to financial journalism is the clearest argument for prioritizing data quality and novelty. The evidence here is counterintuitive and worth sitting with. About 8 to 10% of investment news language is predictable from firm data and carries near-zero return predictability. Markets have already priced the boilerplate.
The CEPR study analyzed millions of Reuters articles using AI models to separate predictable language from genuinely new information. The results showed strong return predictability only for the unexpected component of news. Predictable earnings commentary, standard risk disclosures, and formulaic CEO statements move nothing. Surprising data signals move markets.
| News component | Predictability | Return predictability |
|---|---|---|
| Boilerplate language | High (8–10% of variability) | Near zero |
| Genuinely novel data signals | Low | Statistically significant |
| AI-extracted pure news | Variable | Strong positive correlation |
This finding reshapes how we should think about the role of statistics in journalism. The value of a financial article is not in the volume of data it presents. It is in the proportion of that data that investors have not yet priced. A story that surfaces a previously unreported supplier concentration risk, an unusual pattern in insider trading filings, or a divergence between reported earnings and cash flow is worth far more than one that summarizes what the market already knows.
Pro Tip: When reviewing a draft investment story, ask one question before publishing: does this contain at least one data point that a well-informed analyst could not have predicted from public information available yesterday? If the answer is no, the story adds no signal value.
The practical implication for journalists is to treat novelty as a core editorial criterion alongside accuracy. For investors reading financial journalism, this means learning to read real-time market data alongside published stories to identify which reported figures are genuinely new versus already reflected in prices.
Key takeaways
Data-driven investment journalism produces market-moving stories only when verified sources, editorial framing, and genuinely novel data signals work together as a single system.
| Point | Details |
|---|---|
| Automation accelerates accuracy | AI-assisted pipelines reduce manual errors and cut reporting cycles by 4 to 8 hours per cycle. |
| Context creates investor value | Scale anchoring and peer benchmarking transform raw figures into decisions investors can act on. |
| Source quality determines trust | Verified platforms like CEPRES outperform scraped data for institutional-grade investment reporting. |
| Novelty drives market response | Only the unexpected component of news carries return predictability; boilerplate moves nothing. |
| Data vintage must be disclosed | Reporting the as-of date for any dataset is an editorial obligation, not an optional footnote. |
Our perspective on data’s future in investment journalism
At Handy, we have watched the data journalism conversation shift from “how do we get the data” to “how do we know the data is right.” That is genuine progress. But we think the next frontier is less discussed: the asymmetry between journalists who can process AI-extracted signals and investors who cannot.
The CEPR finding about predictable versus pure news is not just academically interesting. It reveals a structural gap. Newsrooms with AI models that extract genuine signals from millions of articles will consistently surface insights that manual reporters miss. Investors who rely on those newsrooms gain an edge. Investors who read only the boilerplate layer of financial journalism gain nothing they have not already priced.
We also believe data vintage is an underrated editorial obligation. When a story cites fund performance data or private market benchmarks, the as-of date of that data is as important as the figure itself. A benchmark from Q2 published in Q4 can actively mislead an investor making a Q4 decision. Disclosing collection dates should be standard practice, not an afterthought buried in methodology notes.
The journalists who will matter most in the next five years are not the ones who can access the most data. They are the ones who can explain what the data means, verify where it came from, and identify what it does not yet tell us. AI handles volume. Editorial judgment handles meaning. Both are necessary, and neither replaces the other.
Stay ahead with real-time data from Handy.Markets
Investment journalism tells you what happened. Handy tells you what is happening right now.
Handy.Markets aggregates live prices, percentage changes, and alerts across stocks, cryptocurrencies, commodities, forex, indices, and ETFs in one place. When a financial story breaks and you need to verify whether a price move has already occurred or is still unfolding, track it across all markets without switching between platforms. You can also set up instant price alerts via Telegram, Discord, Slack, SMS, or email so you never miss the moment a data signal becomes a market event. For journalists and investors who treat data as a working tool rather than background noise, Handy is where that work starts.
FAQ
What is the role of data in investment journalism?
Data in investment journalism converts raw financial information into verified, contextualized insights that investors can act on. Without structured data and editorial framing, financial reporting produces opinion rather than evidence.
How do AI tools improve investment reporting workflows?
AI tools like LLMs generate SQL queries, automate document processing via OCR, and clean large datasets without manual coding. The Hindu’s newsroom processed 22 million records using this approach, demonstrating the scale now available to financial journalists.
Why does data source quality matter for investment stories?
Scraped or estimated data introduces averaging errors and lacks audit trails, making it unreliable for institutional-grade reporting. Verified platforms like CEPRES apply deterministic resolution rules across 17,200+ funds, producing figures investors and analysts can trust.
What makes a financial news story actually move markets?
CEPR research shows that only the genuinely unexpected component of news carries return predictability. Predictable boilerplate language, which accounts for 8 to 10% of news variability, has near-zero impact on asset prices.
Why should journalists disclose data vintage in investment reporting?
The as-of date of any dataset determines whether the figures reflect current market conditions. Reporting a Q2 benchmark in a Q4 story without disclosure can mislead investors making time-sensitive decisions, making vintage disclosure a core editorial standard.