TL;DR:
- Market liquidity is the ability to buy or sell assets quickly at fair prices without impacting the market adversely. It involves measures like bid-ask spreads, market depth, and trading volume, which collectively reveal true trading costs and risks during normal and stressed conditions. Using real-time monitoring tools, traders can better assess liquidity, avoid hidden costs, and manage risks effectively in dynamic markets.
Most traders think liquidity is just another word for trading volume. That single misconception costs real money every day. What is market liquidity, actually? It is the ability to buy or sell an asset quickly, at a fair price, without your trade itself moving that price against you. Volume is one signal, but it does not tell you how much it will cost to execute, how fast your fill will arrive, or whether the market will absorb your order without slipping. Understanding liquidity in financial markets separates traders who execute well from those who are perpetually surprised by the gap between the price they expected and the price they got.
Table of Contents
- What market liquidity means and why it matters
- Core measures of market liquidity: beyond just volume
- How liquidity dynamics affect trading costs and execution
- Why liquidity can vanish when you need it most
- Practical tips to assess and trade with market liquidity in mind
- Why focusing solely on volume misleads traders about true liquidity
- Use Handy.Markets to monitor market liquidity and set timely alerts
- Frequently asked questions
Key Takeaways
| Point | Details |
|---|---|
| Market liquidity defined | Market liquidity is the ability to buy or sell assets quickly with minimal price impact and stable pricing. |
| Liquidity components | Trading volume, bid-ask spread, and market depth together reveal true liquidity conditions. |
| Liquidity affects costs | Poor liquidity raises execution costs through increased spreads, slippage, and price impact. |
| Liquidity fades in stress | Liquidity can vanish in volatile markets due to opacity and strategic withdrawal by counterparties. |
| Trade with liquidity data | Monitoring spreads, depth, and real-time indicators helps optimize trade timing and execution. |
What market liquidity means and why it matters
Now that we have challenged common assumptions, let us clarify exactly what market liquidity is and why it matters deeply in trading.
Market liquidity means the ease and speed with which an asset can be bought or sold without significantly affecting its price. That definition sounds clean, but the real-world implications run deep. A stock that trades millions of shares daily can still be illiquid for a fund trying to move a $50 million block, because the sheer size of the order will push the price before the position is fully built.
It is also worth distinguishing market liquidity from a related but separate concept: funding liquidity. Market liquidity and funding liquidity are related but distinct concepts. Market liquidity lives in the trading venue itself; funding liquidity is your ability to obtain cash or credit to meet obligations. During the 2008 financial crisis, both collapsed together, which is exactly what made the episode so severe. Normally, though, you can have a very liquid market even when some participants are funding-constrained.
“Liquidity is the connective tissue of financial markets. Remove it and even fundamentally sound assets become impossible to trade at rational prices.”
Here is what a liquid market looks like in practice, compared to an illiquid one:
- High liquidity: Large number of active buyers and sellers, tight bid-ask spreads, fast order execution, minimal price movement from individual trades
- Low liquidity: Few participants, wide bid-ask spreads, slow or uncertain fills, significant price impact from even modest order sizes
Liquidity directly shapes market volatility strategies because assets with thin liquidity tend to experience sharper, more erratic price swings when sentiment shifts. Liquid markets absorb shocks; illiquid ones amplify them.
Core measures of market liquidity: beyond just volume
With a solid definition, let us explore how to measure liquidity using concrete market data signals.
Liquidity has three core components: trading volume, bid-ask spread, and market depth. Each reveals a different layer of how easy or expensive it will be to trade.
- Trading volume shows how actively an asset changes hands over a given period. High volume suggests many participants are willing to transact, but it does not guarantee you can exit a large position without moving the price.
- Bid-ask spread is the gap between what buyers will pay and what sellers will accept. A bid-ask spread is a fast, commonly used observable proxy for market liquidity. The S&P 500’s most liquid ETFs trade with spreads of a fraction of a cent. A micro-cap stock or an exotic currency pair might show spreads of several percent.
- Market depth reveals the size and price distribution of resting orders in the order book. Even if the spread is tight at the top of the book, depth tells you whether a larger order will stay near that price or walk through levels that are far worse.
The table below shows how these three measures compare across market types:
| Market/Asset | Typical volume | Bid-ask spread | Order book depth |
|---|---|---|---|
| Major forex pairs (EUR/USD) | Very high | Very tight (pips) | Deep |
| Large-cap US stocks | High | Tight (cents) | Moderate to deep |
| Mid-cap stocks | Moderate | Wider | Moderate |
| Small-cap stocks | Low | Wide | Shallow |
| Illiquid crypto tokens | Very low | Very wide | Very shallow |
Pro Tip: When comparing financial markets, focus on spreads and depth rather than volume alone. A single large algorithmic trade can inflate volume without reflecting genuine two-sided liquidity. Check real-time market data to see how spreads change throughout the trading day before committing to a trade size.
How liquidity dynamics affect trading costs and execution
Knowing how to measure liquidity is vital, but understanding how it translates into your trading costs is where it really matters.
Every time you trade, you face both explicit costs (commissions, fees) and implicit costs (the spread, slippage, and price impact). In liquid markets, the implicit costs are small. In illiquid ones, they can easily exceed the explicit costs by a factor of ten.

Price impact directly measures the execution cost caused by trade size moving prices in less liquid markets. If you buy 10,000 shares and the act of buying pushes the price up by 0.3% before your last share is filled, that 0.3% is your price impact. It comes directly out of your return.
For institutions managing large positions, this is not theoretical. Firms like Tradeweb measure realized execution costs in basis points to reflect what it actually costs to trade throughout the day, going well beyond the theoretical bid-ask spread. One basis point on a $10 million trade is $1,000. In a less liquid bond, realized costs can run 10 to 30 basis points or more.
“Slippage is not bad luck. It is the price you pay for trading in a market that cannot absorb your order at the quoted price.”
Use this process to evaluate liquidity cost before placing a significant trade:
- Check the current bid-ask spread for the instrument to understand your immediate entry cost.
- Review the order book depth to see how many shares or contracts are available at or near the current price.
- Estimate your order’s size relative to average daily volume to gauge whether your trade will move the market.
- Consider splitting large orders into smaller tranches spread across time to reduce price impact.
- Use market fluctuation analysis to time your trade during high-liquidity windows, typically mid-session for most equity markets.
Tracking liquidity cost over multiple trades also helps you benchmark your own execution quality and improve over time.
Why liquidity can vanish when you need it most
Understanding normal liquidity is critical, but knowing why it breaks down helps you anticipate risks during volatile markets.
During periods of market stress, a paradox emerges. The desire to trade spikes, but the ability to do so at reasonable prices collapses. This is not random. Liquidity evaporation during stress arises from market opacity and strategic withdrawal by liquidity providers. When uncertainty is high, market makers widen their spreads dramatically or pull their quotes entirely to avoid being caught on the wrong side of a fast-moving market.
Here is why this happens and how the feedback loop forms:
- Market makers and non-traditional liquidity providers (hedge funds, high-frequency traders) reduce their activity when they cannot accurately assess risk.
- Opacity about other participants’ positions prevents accurate pricing of risk, so the rational response is to step back.
- As spreads widen, more traders rush to transact before conditions worsen, which increases order flow in a thinning market.
- That increased demand with reduced supply of liquidity accelerates price moves and further discourages liquidity provision.
The March 2020 COVID sell-off illustrated this vividly. Even U.S. Treasury bonds, among the world’s most liquid assets, experienced a brief but alarming liquidity evaporation. Bid-ask spreads on Treasuries widened tenfold in a matter of days.
Pro Tip: Monitor market volatility signals through real-time market monitoring alerts to catch early signs of deteriorating liquidity before placing large orders during high-stress periods.
Practical tips to assess and trade with market liquidity in mind
With knowledge of liquidity dynamics and risks, here is how to apply these insights to your trading strategy.
Liquidity is multi-dimensional and varies intraday; spreads and depth can deteriorate around news events or market open and close. This means execution timing matters as much as instrument selection.
Follow these steps to trade with liquidity awareness:
- Monitor bid-ask spreads and order book depth before executing any trade where size matters. This takes under a minute and can save you significant slippage.
- Avoid market orders during thin liquidity windows, such as in the first and last 15 minutes of a trading session, when spreads are typically widest.
- Schedule trades away from major data releases (payroll reports, central bank decisions) where liquidity can dry up unpredictably in the minutes before and after the announcement.
- Use limit orders to define the maximum price you are willing to pay or the minimum you will accept, protecting you from poor fills in fast or illiquid markets.
- Assess market volatility conditions alongside liquidity, since volatility and poor liquidity tend to arrive together.
- Review your execution results against a liquidity baseline using a trading checklist to identify patterns in where slippage is costing you most.
Pro Tip: Use a platform that surfaces real-time price alerts to catch moments when liquidity tightens or opens up, giving you a timing edge without having to stare at screens all day.
Why focusing solely on volume misleads traders about true liquidity
Having seen practical tips, let us consider a fresh perspective on how liquidity metrics guide smarter trading decisions.
Here is something that surprises most traders: volume and liquidity are not the same thing, and in certain situations they move in opposite directions. High volume alone can hide poor execution conditions if the order book is shallow or spreads widen when you trade. This happens most visibly in momentum-driven markets where volume surges as prices move fast, but the order book empties out because market makers have pulled their resting quotes.
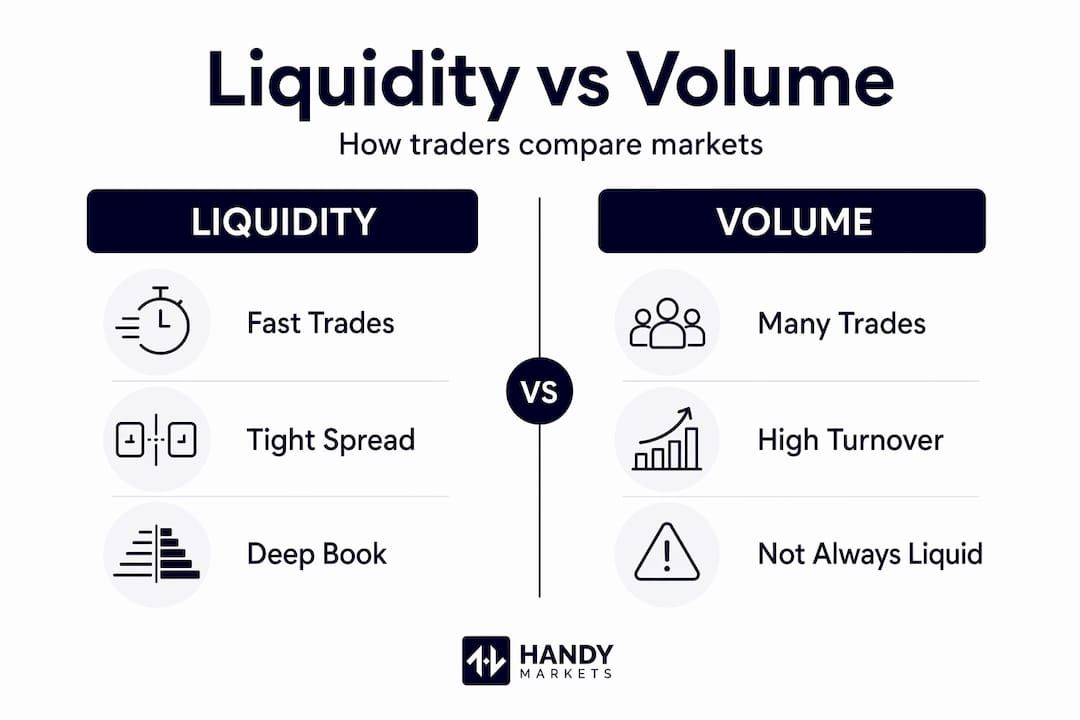
We have seen this in crypto markets repeatedly. During a major news catalyst, a mid-tier token can show a 500% volume spike while its effective spread balloons from 0.5% to 8%. A trader watching only the volume bar would assume the market is liquid. The trader watching the spread and depth would know it is not.
Liquidity assessment requires multiple dimensions, including price impact, spread, and depth, because focusing on one metric can misrepresent true costs. This is not just relevant for exotic assets. Even in large-cap stocks, volume can surge on a single aggressive buyer or seller, while the book on the other side remains thin for anyone trying to trade against that flow.
The professional approach is to build a liquidity scorecard before any significant trade: check the spread, look at two or three levels of depth in the order book, note recent volume relative to average, and consider whether the current environment (pre-announcement, end of session, stressed market) warrants extra caution.
Comparing across markets also sharpens your sense of what normal liquidity looks like for each asset class, making it easier to spot when conditions have deteriorated.
Pro Tip: Never rely on a single liquidity indicator. Combine spread, depth, and recent price impact data for a grounded view of whether now is actually a good time to execute.
Use Handy.Markets to monitor market liquidity and set timely alerts
To put these insights into action, Handy.Markets offers tools designed to empower your liquidity-aware trading.
Watching liquidity conditions manually across multiple assets is exhausting. Handy.Markets makes it practical. The platform delivers real-time data across cryptocurrencies, stocks, forex, commodities, and indices, all in one place, so you always have the context you need to judge whether a market is ready for your trade.
You can set up price alerts in minutes across Telegram, Discord, Slack, SMS, Email, or Webhook, so you are notified the moment a meaningful price move signals a shift in liquidity conditions. Use the full markets dashboard to track spreads and movements across asset classes simultaneously, and set targeted alerts on individual assets like Aerodrome Finance to catch entry windows without watching screens all day. Handy.Markets turns passive monitoring into an active edge.
FAQ
What is the difference between market liquidity and funding liquidity?
Market liquidity refers to how easily an asset can be traded without affecting its price, while funding liquidity is a participant’s ability to obtain cash or financing to meet obligations. These are related but distinct; they can reinforce each other during crises but behave independently under normal conditions.
How does bid-ask spread reflect market liquidity?
A narrower bid-ask spread signals higher liquidity because buyers and sellers agree on prices within a tighter range, reducing your cost to enter and exit. The bid-ask spread is one of the fastest and most reliable observable proxies for real-time liquidity conditions.
Why does liquidity sometimes disappear during market stress?
Liquidity evaporates during stress because opacity and uncertainty cause liquidity providers to withdraw, widening spreads and thinning order books, precisely when demand to trade is highest. This self-reinforcing dynamic makes stressed markets far more expensive and unpredictable to trade in.
How can traders assess true liquidity costs beyond just looking at volume?
Traders should evaluate bid-ask spreads, order book depth, and realized price impact together, because volume alone can mask a shallow book or widening spreads that inflate your actual execution cost well beyond what the headline price suggests.