TL;DR:
- Portfolio tracking involves systematically recording holdings and reviewing performance using key metrics like TWR and CAGR. Following a disciplined schedule and creating a clear investment policy helps maintain proper asset allocation and improve decision-making. Real-time data and proper tools enable effective monitoring, rebalancing, and accountability in portfolio management.
Portfolio tracking step by step is the structured practice of systematically recording, measuring, and reviewing every holding in your investment portfolio to make better decisions. Professional wealth managers rely on two core metrics for this work: Time-Weighted Return (TWR), which removes the distortion of cash deposits and withdrawals, and CAGR (Compound Annual Growth Rate), which converts any return into an annualized figure for fair comparison. A disciplined portfolio tracking cadence includes weekly five-minute glances, monthly 30-minute reviews, quarterly one-to-two-hour deep dives, and a half-day annual assessment. That rhythm separates investors who react to noise from those who manage with intention.
How to start your portfolio tracking step by step
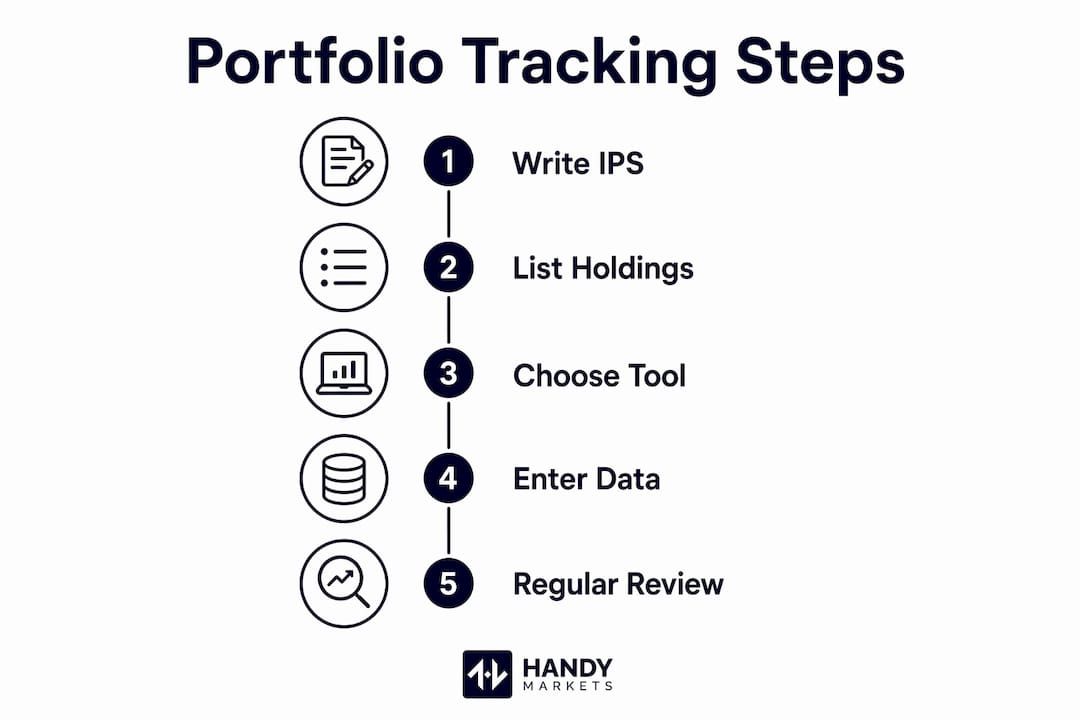
Every effective tracking system begins before you open a spreadsheet. The first task is writing an Investment Policy Statement (IPS). An IPS defines your financial goals, your risk tolerance, your time horizon, and any constraints such as tax status or liquidity needs. Professional wealth managers treat the IPS as the foundation of portfolio management because it gives you an objective benchmark. Without it, you measure performance against nothing, and emotional decisions fill the gap.

Once your IPS exists, list every account and every holding you own. That means brokerage accounts, retirement accounts, crypto wallets, real estate investment trusts, and any foreign currency positions. Most investors are surprised by what they find. Setting up your tracker often reveals forgotten accounts, hidden fee structures, and dangerous concentration in one sector or asset class. The setup phase is not just administrative. It is your first real portfolio analysis.
Choosing the right tool depends on your portfolio’s size and complexity. The table below maps common situations to appropriate tracking methods.
| Portfolio type | Recommended method | Key benefit |
|---|---|---|
| 5–10 positions, single account | Spreadsheet (Excel or Google Sheets) | Full control, low cost |
| 11–30 positions, multi-account | Dedicated tracker app | Consolidated view, faster updates |
| 30+ positions or multi-asset | Automated platform with live data | Real-time pricing, allocation alerts |
| Crypto-heavy or multi-currency | Specialized multi-asset tracker | Cross-asset visibility, FX handling |
Spreadsheets work well for small portfolios of 5–10 positions, but larger or multi-asset portfolios require dedicated trackers or automated systems for real-time updates. Choosing the wrong tool for your portfolio size creates friction that causes most investors to abandon tracking entirely.
Pro Tip: Write your IPS before you enter a single ticker symbol. A one-page document covering your target return, maximum drawdown tolerance, and asset class limits will save you from dozens of impulsive decisions later.
Step-by-step setup: entering data and building your workflow
With your goals defined and your holdings listed, you are ready to build the actual tracker. Follow these steps in order.
- Create your master holdings list. Enter every position with its ticker or asset name, purchase date, purchase price, number of units, and the account it lives in. Manual entry takes roughly two minutes per holding, so a 20-position portfolio takes about 40 minutes to set up correctly.
- Add current price columns. In a spreadsheet, use a data import formula (such as GOOGLEFINANCE in Google Sheets) to pull live prices automatically. In a dedicated app, connect your brokerage via read-only API or enter prices manually on a schedule.
- Calculate position weights. Divide each position’s current value by your total portfolio value. This gives you your actual allocation. Compare it against your IPS target allocation to spot drift immediately.
- Set up a return column. Calculate simple return first: (current value minus cost basis) divided by cost basis. Then, if your tracker supports it, add a TWR column for accurate performance measurement across periods with deposits or withdrawals.
- Build a review schedule. Block recurring calendar time: five minutes every Monday morning for a total value check, 30 minutes on the first of each month for a net worth and allocation review, and a deeper session every quarter for rebalancing decisions.
- Add a notes column. Record why you own each position and what would cause you to sell it. This single habit separates disciplined investors from reactive ones.
For investors managing crypto alongside stocks and commodities, tracking multi-asset portfolios effectively requires a platform that handles different pricing frequencies and currency conversions in one place.
Pro Tip: Do not wait until your tracker is perfect to start using it. Enter your top five positions today and add the rest over the following week. A working 80% tracker beats a perfect tracker you never finish building.
What metrics should you monitor for performance evaluation?
The most common tracking mistake is measuring only profit and loss in dollar terms. Dollar P&L tells you nothing about whether your portfolio performed well relative to risk or time. These are the metrics that actually matter.
- Time-Weighted Return (TWR): TWR accounts for the timing of deposits and withdrawals, making it the standard for comparing your performance against a benchmark like the S&P 500. Use it whenever you have added or withdrawn cash during the measurement period.
- CAGR (Compound Annual Growth Rate): CAGR converts any multi-year return into an annualized figure. A 40% gain over three years equals roughly 11.9% CAGR. That number is directly comparable to any index or fund return you read about.
- Position weight and allocation drift: Track what percentage of your portfolio each asset class represents. Markets move, and a portfolio that started at 60% equities and 40% bonds can drift to 75/25 within a year without a single trade.
- Dividend and fee impact: Gross returns look better than net returns. Always subtract management fees, transaction costs, and tax drag to see your true gain. Dividends, conversely, add to total return and should be reinvested or tracked separately.
- Benchmark comparison: Choose one benchmark relevant to your strategy, such as the S&P 500 for a US equity portfolio or a blended index for a mixed portfolio. Measuring against a benchmark shows whether your active decisions added value or subtracted it.
The majority of portfolio returns are driven by asset allocation rather than individual stock picking or market timing. That finding reframes the entire purpose of tracking. You are not monitoring stocks. You are monitoring your allocation.
How do you maintain your portfolio and avoid common mistakes?
Consistent maintenance is where most investors lose discipline. The review cadence described earlier gives you structure, but knowing what to do during each review is equally important.
During your weekly glance, check total portfolio value and flag any position that has moved more than 10% in either direction. You are not making decisions here. You are staying aware.
During your monthly review, recalculate your allocation percentages and compare them to your IPS targets. Check whether any dividends were paid and whether they were reinvested correctly. Update your notes column with any news that affects your thesis for a holding.
During your quarterly deep dive, run your TWR calculation and compare it to your chosen benchmark. Decide whether any positions have drifted far enough to trigger rebalancing. Active rebalancing enforces a “buy low, sell high” discipline by selling outperformers and buying underperformers to restore your target allocation. It controls risk and, over long periods, tends to improve returns.
Tracking your portfolio without written commentary is like reading a financial statement with no footnotes. The numbers show what happened. Your notes explain why it happened and what you should do next. That context is what turns data into decisions.
Three mistakes consistently undermine tracking efforts. First, relying on brokerage dashboards alone creates a fragmented view because each platform shows only its own holdings, hiding your true cross-asset allocation. Second, ignoring the narrative behind the numbers leads to gut-based decisions that contradict your IPS. Third, obsessing over individual stock performance while ignoring overall allocation drift misses the factor that drives most of your returns.
For crypto investors who want a structured approach to rebalancing, a step-by-step crypto rebalancing guide walks through the mechanics of restoring target weights across digital assets. The same logic applies to any asset class.
Pro Tip: Set price alerts for every major position at your target buy and sell levels. Alerts replace the need to check prices constantly and keep you focused on your review schedule rather than market noise. Handy Markets supports alerts via Telegram, Discord, Slack, SMS, and email.
Key Takeaways
Effective portfolio tracking requires a defined process, the right metrics, and a consistent review schedule applied across all accounts and asset classes.
| Point | Details |
|---|---|
| Start with an IPS | Define your goals and risk tolerance before entering any data. |
| Consolidate all accounts | Track every holding in one place to see your true allocation. |
| Use TWR and CAGR | These metrics give accurate, comparable performance data beyond simple P&L. |
| Follow a review cadence | Weekly, monthly, quarterly, and annual reviews each serve a distinct purpose. |
| Rebalance with discipline | Restore target allocation regularly to control risk and enforce buy-low logic. |
What disciplined tracking has taught us at Handy Markets
The investors who improve the most are not the ones who check prices every hour. They are the ones who built a repeatable process and stuck to it.
We have seen a consistent pattern: the setup phase is where the real discoveries happen. Investors who sit down to build their first consolidated tracker almost always find something they did not expect. A forgotten retirement account from a previous employer. A fee structure that quietly eroded three years of gains. A 40% concentration in one sector they thought was diversified. The setup phase is not just data entry. It is a full audit of your financial life.
The second thing we have learned is that documented commentary transforms tracking from a chore into a decision-making tool. When you write one sentence explaining why you bought a position and what would make you sell it, you create a record that holds you accountable to your own logic. Six months later, when a position is down 20%, you can read your original thesis and decide whether the thesis changed or just the price. That distinction is worth more than any indicator.
Start with five positions. Build the habit. Then scale the system. Sophistication comes from repetition, not from complexity.
Real-time tracking with Handy Markets
A solid tracking system needs live data to stay accurate between your scheduled reviews.
Handy Markets aggregates real-time prices across cryptocurrencies, stocks, commodities, forex, indices, and ETFs in one place. You can track all asset classes without switching between platforms, which solves the fragmented-view problem that undermines most brokerage-based tracking. Setting up free price alerts takes under a minute, and notifications reach you through Telegram, Discord, Slack, SMS, Webhook, or email. When a position hits your target level, you know immediately. That keeps your review schedule clean and your decisions grounded in your IPS rather than in daily market noise.
FAQ
What is portfolio tracking step by step?
Portfolio tracking step by step is the structured process of recording all holdings, calculating key metrics like TWR and CAGR, and reviewing performance on a defined schedule. The goal is to measure results objectively and maintain your target asset allocation over time.
How often should I review my portfolio?
A disciplined cadence includes a five-minute weekly check, a 30-minute monthly review, a one-to-two-hour quarterly deep dive, and a half-day annual assessment. Each review serves a different purpose, from staying aware to making rebalancing decisions.
What is the difference between TWR and simple return?
Simple return measures the percentage gain on your invested capital without adjusting for cash flows. TWR removes the impact of deposits and withdrawals, making it the standard metric for comparing your performance against a benchmark.
Why should I avoid relying only on brokerage apps?
Brokerage dashboards show only the holdings within that single platform. They give you no consolidated view across accounts or asset classes, which means your true allocation and total performance remain invisible.
When should I rebalance my portfolio?
Rebalance when any asset class drifts more than 5% from its IPS target, or at minimum during your quarterly review. Active rebalancing restores your target allocation and enforces a buy-low discipline by trimming outperformers and adding to underperformers.