TL;DR:
- Choosing where to invest can be overwhelming due to the different characteristics, risks, and returns of each asset class. Diversification across assets reduces risk since they typically do not decline simultaneously, but market cycles and timeframes significantly impact performance comparisons. Using risk-adjusted metrics and evaluating liquidity, correlation, and costs helps make informed, goal-driven investment decisions.
Choosing where to put your money feels overwhelming when every asset class comes with its own language, risks, and return history. Stocks promise growth but swing hard. Bonds offer calm but rarely excite. Commodities hedge inflation. Crypto moves like nothing else in finance. If you have ever tried to line these up side by side and figure out which belongs in your portfolio, you already know the problem: they do not compare easily. This guide to comparing asset classes cuts through that confusion, giving you a clear framework built on the metrics, mechanics, and market realities that actually matter for informed decisions.
Table of Contents
- Understanding key asset classes and their characteristics
- Evaluating performance and risk: metrics that matter
- How market cycles and time horizons affect asset class comparisons
- Comparing liquidity, pricing mechanics, and hidden risks across asset classes
- Step-by-step framework for comparing asset classes for your portfolio
- Why most asset class comparisons miss the mark and how to do it right
- Track and compare asset classes easily with Handy.Markets
- Frequently asked questions
Key Takeaways
| Point | Details |
|---|---|
| Diverse asset classes | Stocks, bonds, cash, commodities, and cryptocurrencies each serve different roles and risk profiles in your portfolio. |
| Use multiple metrics | Combine returns with risk measures like Sharpe ratio and maximum drawdown for fair asset comparisons. |
| Evaluate multiple horizons | Look at 1-, 3-, 5-, and 10-year performance to avoid misleading conclusions from any single year. |
| Consider liquidity and correlation | Assess how liquidity and changing correlations impact your costs and diversification benefits. |
| Align with goals | Choose asset classes based on whether you prioritize portfolio defense or growth objectives. |
Understanding key asset classes and their characteristics
Before we can compare, we need to know what we are working with. Asset classes are groups of investments that share similar characteristics, legal structures, and market behaviors, though each carries its own unique risk and return profile. Think of them as different instruments in an orchestra. Each plays a role, and the sound changes dramatically depending on how you combine them.
Here is a quick breakdown of the main types of asset classes:
- Stocks (equities): You own a slice of a company. When the company grows, your slice is worth more. Higher growth potential, but also higher price swings.
- Bonds (fixed income): You are lending money to a government or corporation in exchange for regular interest payments. Lower risk, steadier income, but limited upside.
- Cash equivalents: Savings accounts, CDs, and money market funds sit here. Safe and liquid, but returns barely keep pace with inflation.
- Commodities: Physical goods like gold, oil, and wheat. They often move independently of stocks, making them a useful inflation hedge.
- Cryptocurrencies: Increasingly recognized as a distinct asset class, crypto brings decentralized exposure but with volatility that can dwarf anything in traditional markets.
- Real estate: Often included in broader asset class discussions, real estate offers income through rent and long-term appreciation.
A good comparing financial markets guide will always remind you that each class fulfills a different portfolio role. Stocks drive growth. Bonds dampen volatility. Commodities protect purchasing power. Cash keeps your options open. PIMCO’s asset class framework frames this well: different assets serve different purposes depending on where you are in the economic cycle.
| Asset class | Primary role | Typical risk level | Liquidity |
|---|---|---|---|
| Stocks | Growth | High | High |
| Bonds | Stability / income | Low to medium | High |
| Cash equivalents | Capital preservation | Very low | Very high |
| Commodities | Inflation hedge | Medium to high | Medium |
| Cryptocurrencies | Speculative growth | Very high | High (varies) |
| Real estate | Income + appreciation | Medium | Low |
Pro Tip: Diversification across asset classes reduces your overall portfolio risk not because all assets go up together, but because they often do not fall at the same time. That is the real power of spreading exposure across investment articles and asset types.
Having introduced the common asset classes, next we will learn how to gauge their performance through historical returns and volatility.
Evaluating performance and risk: metrics that matter
Raw returns tell you what happened. Risk-adjusted metrics tell you whether it was worth it. This distinction is where most retail investors stumble, and it is the heart of any serious investment comparison guide.
Here are the core metrics you need to know:
- Historical return: The percentage gain or loss over a defined period. Always look at multiple timeframes: 1, 3, 5, and 10 years.
- Standard deviation: Measures how much returns fluctuate around the average. A high standard deviation means more volatility, which signals more uncertainty.
- Sharpe ratio: This divides excess return (return above a risk-free rate like Treasury bills) by standard deviation. A higher Sharpe ratio means you are being better compensated for the risk you take.
- Maximum drawdown: The biggest peak-to-trough loss over a period. Bitcoin, for example, has experienced drawdowns exceeding 80% from peak. That number matters far more than the average annual return when you are deciding how much you can stomach.
- Beta: Measures how much an asset moves relative to a benchmark, usually the S&P 500. A beta above 1 means more volatility than the market.
| Metric | What it tells you | Best used for |
|---|---|---|
| Historical return | Past performance by period | Baseline comparison |
| Standard deviation | How much returns swing | Volatility assessment |
| Sharpe ratio | Return per unit of risk | Comparing across asset classes |
| Maximum drawdown | Worst-case loss scenario | Tail risk evaluation |
| Beta | Market sensitivity | Understanding correlation to equities |
Pro Tip: Never judge an asset class on its 1-year return alone. A high return with a terrible Sharpe ratio means you took on excessive risk for what you got. Check our market volatility strategies for practical ways to apply these metrics in live markets.
It is also worth reading our volatility investing guide if terms like standard deviation still feel abstract. Understanding volatility as the heartbeat of an asset’s price behavior helps you appreciate why two assets with identical 5-year returns can feel completely different to hold.
With the key metrics understood, we now explore how market behavior affects asset class returns over time.
How market cycles and time horizons affect asset class comparisons
Here is something most beginner investment guides skip: the best-performing asset class last year is statistically likely to underperform next year. Return rankings flip dramatically from year to year, and investors who chase last year’s winner often buy at the peak.
The BlackRock return map is a sobering visual. It shows asset class rankings reshuffled almost entirely from one year to the next. Commodities soared in 2022 while growth stocks fell apart. Crypto obliterated everything in 2020 and 2023, then lost over half its value in between. U.S. equities have led for stretches of the 2010s, then ceded ground to international markets.
What this means practically:
- Short-term comparisons mislead. A 1-year snapshot is useful for context but dangerous as a decision-making tool on its own.
- 3 to 5-year windows smooth out single-cycle noise and give you a clearer read on an asset’s underlying character.
- 10-year data captures at least one full market cycle, which is where patterns become meaningful.
- Crypto behaves on its own cycle. Bitcoin and Ethereum have historically moved in roughly 4-year cycles tied partly to Bitcoin’s halving schedule, making them especially tricky to evaluate using traditional market-cycle frameworks.
Comparing investing types without accounting for where we are in the economic cycle is like comparing sprint times without noting whether the track was wet. Context changes everything. The financial markets overview at Handy.Markets helps you monitor where different assets stand in real time, so you can anchor your comparisons to current conditions, not stale data.
Understanding timeframes leads us to examine how liquidity and pricing further affect asset class comparisons, especially for emerging assets like cryptocurrencies.
Comparing liquidity, pricing mechanics, and hidden risks across asset classes
Liquidity is one of the most underestimated factors in how to compare asset classes. It is not just about how easily you can sell. It determines your actual execution price, your trading costs, and how much slippage you absorb in fast-moving markets.

For traditional assets like large-cap stocks and government bonds, liquidity is deep and reliable. The spread between buy and sell prices is tiny. But step into commodity futures, small-cap stocks, or crypto markets and the picture changes fast.
Cryptocurrency ETFs (exchange-traded funds) add another layer. Crypto ETPs introduce liquidity and tracking risks that are separate from owning the underlying asset directly. The price you see on the ETF ticker may not perfectly reflect what Bitcoin is actually trading at on spot markets, especially during volatile sessions. That gap is called tracking error, and it can eat into returns in ways that are invisible until you look closely.
Key liquidity and pricing factors to assess when comparing financial markets:
- Bid-ask spread: Tighter spreads mean lower transaction costs and better pricing.
- Trading volume: Higher volume generally means better liquidity and less price impact when you buy or sell.
- Tracking error (for ETFs/ETPs): How closely does the fund replicate the underlying asset’s price?
- Market hours: Stocks trade set hours. Crypto trades 24/7. That difference affects how quickly you can react to news.
Then there is correlation, which most investors treat as a fixed number. It is not. Correlation between asset classes shifts with macroeconomic conditions, interest rate cycles, and the timeframe you are measuring. During the 2020 COVID crash, nearly every asset class fell together, briefly stripping diversification of its protective value. That is conditional correlation in action, and it is why building a portfolio on static correlation assumptions is risky.
Pro Tip: When evaluating crypto against traditional assets, look at comparing financial markets over multiple economic phases, not just the most recent bull market. That gives you an honest picture of how the correlation actually behaves under stress.
Step-by-step framework for comparing asset classes for your portfolio
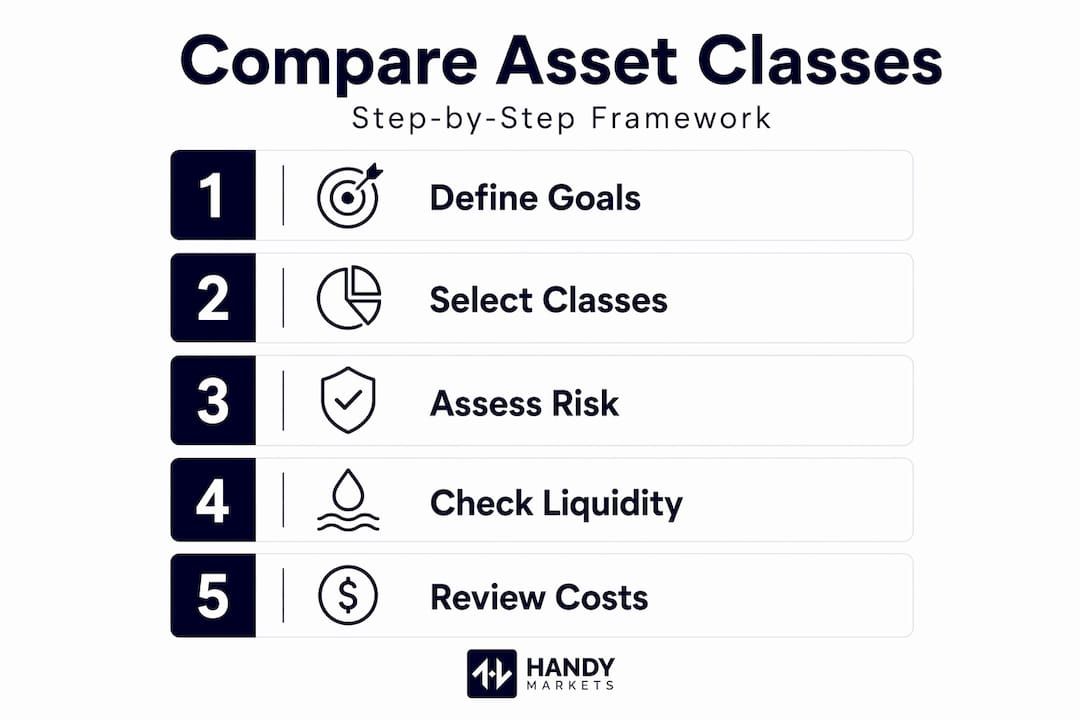
Now we pull it all together. Here is a practical process you can follow every time you are evaluating which asset classes deserve space in your portfolio. Think of it as your personal asset class comparison guide.
- Define your objective. Are you building for long-term growth, protecting existing wealth, or generating income? PIMCO frames this as a defense versus growth question, and getting this clear upfront determines which metrics matter most.
- Gather your data. Collect historical returns across 1, 3, 5, and 10-year periods for each asset class you are considering. Include standard deviation, Sharpe ratio, and maximum drawdown.
- Compare risk-adjusted performance. Do not compare raw returns. A stock index with a 12% return and a Sharpe ratio of 0.8 is more interesting than a crypto asset with a 40% return and a Sharpe ratio of 0.3.
- Assess liquidity and execution costs. Factor in trading fees, bid-ask spreads, and any ETF tracking error relevant to your chosen investment vehicles.
- Evaluate correlation conditionally. Look at how your candidate assets correlated during past market downturns, not just in normal conditions.
- Check the regulatory environment. Crypto regulations, commodity trading rules, and tax treatment differ significantly and can affect your net returns.
- Revisit regularly. Market conditions evolve. What worked as an asset allocation in 2022 may need adjustment in 2026.
For investors thinking about the year ahead, our investment strategies 2026 article pairs well with this framework.
Pro Tip: Build a simple spreadsheet with each asset class as a row and each metric as a column. Updating it quarterly takes 20 minutes and keeps your comparisons grounded in current data, not memory.
Why most asset class comparisons miss the mark and how to do it right
We have reviewed a lot of comparisons over the years, and the same mistakes show up repeatedly. The biggest one is recency bias: investors see that tech stocks or Bitcoin had a spectacular run and assume that momentum will continue indefinitely. It almost never does.
The second mistake is treating correlation as a fixed value. Many portfolios were built on the assumption that bonds would always cushion equity losses. The 2022 market showed how badly that assumption can fail when both asset classes drop simultaneously under rising rate pressure. The lesson from common financial markets comparison pitfalls is that static assumptions create fragile portfolios.
Third, investors regularly overlook the practical cost of holding certain assets. Crypto ETFs have expense ratios. Commodity futures roll costs erode returns. These are not minor footnotes; they can meaningfully alter the ranking of best asset classes to invest in when you account for total cost of ownership.
Our take is this: the investors who compare asset classes well are not necessarily the ones with the most data. They are the ones who ask better questions. Not just “what returned the most?” but “what returned the most per unit of risk, across multiple cycles, after all costs, given my specific goal?” That is a harder question, but it leads to much better decisions.
Track and compare asset classes easily with Handy.Markets
Putting this framework into practice requires reliable, real-time data across all asset classes in one place. That is exactly what Handy.Markets is built for.
Whether you are monitoring crypto prices, checking live stock movements, or watching commodity shifts, you can track financial markets across all major asset classes without switching between a dozen tabs. When a key price level you have been watching approaches, the platform lets you set price alerts delivered through Telegram, Discord, Slack, SMS, or email, so you never miss a critical move. You can also monitor live ETF prices to keep an eye on tracking accuracy and liquidity in real time. Free to use, easy to set up, and built for investors who want clarity without noise.
FAQ
What are the main asset classes I should consider as a retail investor?
The primary asset classes include stocks (equities), bonds (fixed income), cash or cash equivalents, commodities, and real estate, with cryptocurrencies now widely treated as a distinct class worth evaluating separately.
How can I compare the risk and return of different asset classes?
Use risk-adjusted metrics such as the Sharpe ratio, which measures return relative to volatility, alongside maximum drawdown to understand the worst-case loss scenario for each asset class.
Why do asset class returns vary so much from year to year?
Return rankings shift dramatically due to changing economic cycles, interest rate environments, and investor sentiment, which is why evaluating performance across multiple timeframes gives a far more reliable picture than any single year.
Are cryptocurrencies correlated with traditional asset classes?
Correlation is conditional and shifts with macroeconomic regimes and the measurement timeframe, meaning crypto may act independently in some conditions but move in sync with risk assets during market stress events.
What practical steps can I take to compare asset classes effectively?
Define your investment goal, gather data on returns and risk metrics across multiple timeframes, assess liquidity and execution costs, evaluate correlation under stress conditions, and revisit your analysis regularly as PIMCO’s framework for defense versus growth goals makes clear.