
TL;DR:
- A systematic market insights process converts market questions into evidence-based strategies through data collection, analysis, and synthesis. Financial professionals must define precise, decision-aligned research questions and triangulate findings from federal secondary data and primary research to ensure reliable insights. Presenting clear, strategy-focused reports and continuously monitoring market data are essential for making confident investment decisions.
The process for market insights is a systematic method that converts market questions into evidence-based strategies by collecting, analyzing, and applying data across primary and secondary sources. For financial professionals and market researchers, this process is the difference between an investment thesis built on assumptions and one grounded in verifiable data. Done well, it draws on tools ranging from U.S. Census Bureau datasets and Bureau of Labor Statistics benchmarks to targeted surveys and FRED economic indicators. Done poorly, it produces reports that sit unread and decisions that miss the mark.
What is the process for market insights?
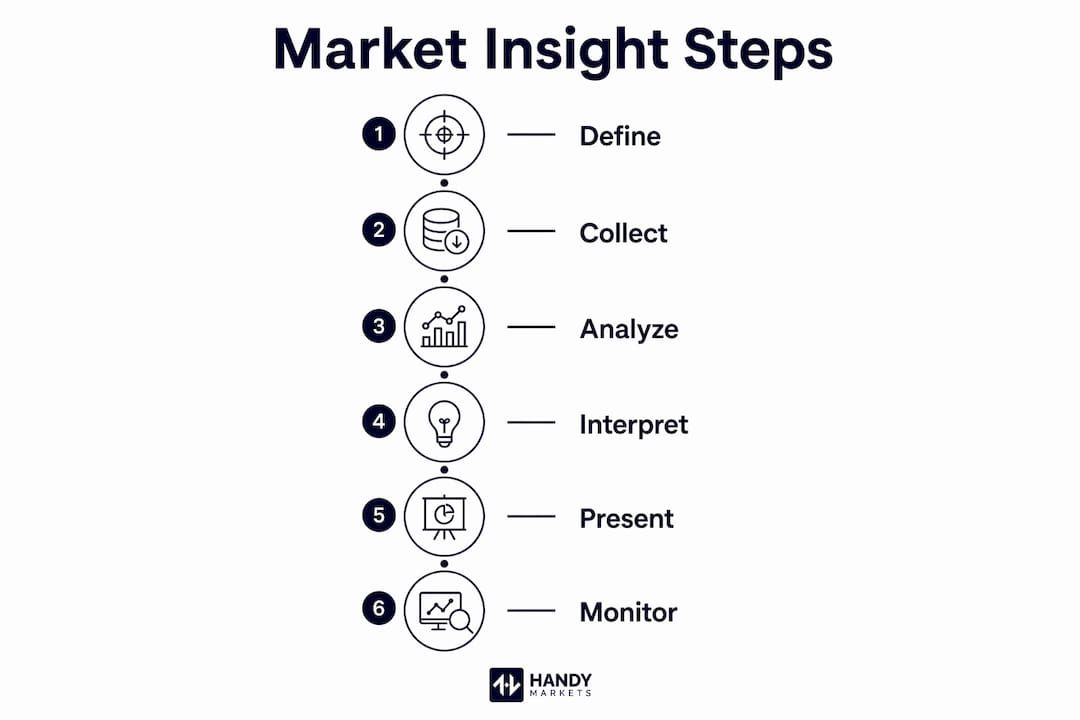
The market insights process, known formally as the marketing research process, is a six-stage cycle: define the research question, design the study, collect data, analyze findings, synthesize implications, and present recommendations. Each stage feeds directly into the next, so a weak question in stage one creates compounding problems through every stage that follows. Financial professionals who skip the design stage and jump straight to data collection often find themselves drowning in numbers that answer the wrong question entirely.

The core output is not a data dump. Incomplete or outdated market analysis consistently fails to inform strategic decisions and risks misdirected investments. The goal is a clear, decision-ready set of findings that a portfolio manager or strategy director can act on within hours of reading.
How to define effective research questions for market insights
Every reliable market analysis process starts with a precise research question, not a broad topic. “What is the size of the U.S. electric vehicle charging infrastructure market?” is a research question. “Tell me about EVs” is not. The specificity of your question determines the quality of every data point you collect afterward.
Strong research questions share three characteristics:
- Decision alignment. The question must connect directly to a business or investment decision. If the answer would not change what you do, the question is not worth asking.
- Measurability. The question must be answerable with data. “Is this market attractive?” is subjective. “What is the five-year compound annual growth rate of this market?” is measurable.
- Scope control. Broad questions produce broad answers. Narrow your scope to a specific geography, customer segment, or time period before you begin.
Common question categories for financial professionals include market sizing (total addressable market and serviceable addressable market), growth trajectory, customer segmentation, competitor positioning, and regulatory risk. A single research project should address no more than three to five of these categories. Trying to answer all of them at once produces a report that is wide but shallow, which is the most common failure mode in corporate market research.
Strategic alignment matters here too. Before finalizing your research questions, map each one to a specific decision or milestone. If your firm is evaluating a sector allocation shift, your questions should directly address the factors driving that decision, not adjacent topics that feel interesting but do not move the needle.
What are the critical tools and sources for gathering market data?
The most efficient market analysis process starts with secondary research before spending a dollar on primary data collection. Secondary research from federal sources like the U.S. Census Bureau, Bureau of Labor Statistics, and FRED provides baseline market data at zero cost. This baseline tells you what you already know before you spend budget finding out what you do not.
Here is a comparison of the most commonly used data sources:
| Source | Type | Cost | Best For |
|---|---|---|---|
| U.S. Census Bureau (CBP) | Secondary | Free | Establishment counts, market sizing |
| Bureau of Labor Statistics | Secondary | Free | Wage benchmarks, employment trends |
| FRED (Federal Reserve) | Secondary | Free | Macroeconomic indicators, interest rates |
| SurveyMonkey / Qualtrics | Primary | Low to mid | Customer surveys, quantitative data |
| In-depth interviews | Primary | Mid to high | Qualitative insight, behavioral drivers |
| Focus groups | Primary | High | Concept testing, sentiment analysis |
| Industry reports (IBISWorld, Statista) | Secondary | High | Sector-specific sizing and forecasts |
NAICS codes are critical for accurately querying federal datasets. Without the correct six-digit NAICS code for your target industry, your Census Bureau and BLS data extractions will be inaccurate or incomplete, which undermines every calculation built on top of them.
Pro Tip: Before running a single survey, spend two hours pulling Census CBP data, BLS occupational statistics, and FRED trend lines for your target market. You will often find that 60 to 70 percent of your secondary questions are already answered, and you can focus primary research budget on the gaps that actually require original data.
Financial professionals benefit most from blending federal secondary data with focused primary studies. The federal data gives you scale and credibility; the primary research gives you the customer-specific texture that no government dataset can provide.
Step-by-step execution of the market analysis process
Executing the market insights process requires a written research plan before any data collection begins. That plan should specify your research questions, data sources, collection methods, sample size targets, timeline, and the analytical techniques you will apply. Without this document, research projects drift, timelines slip, and findings become difficult to defend.
Here are the core execution steps:
- Finalize your research plan. Document your questions, methods, sample targets, and timeline. Assign ownership for each data collection task.
- Execute secondary research first. Pull federal datasets like Census CBP and BLS statistics. Record your NAICS codes and document every source with retrieval dates.
- Design and deploy primary research. For quantitative surveys, 150 to 400 responses provide reliable baseline data. Below 150, your confidence intervals widen to the point where findings become difficult to defend to stakeholders.
- Apply descriptive and inferential statistics. Calculate means, medians, and standard deviations for quantitative data. Use confidence intervals to communicate the precision of your estimates. A finding reported as “72% of respondents prefer X (95% CI: 68–76%)” is far more credible than “most respondents prefer X.”
- Triangulate across sources. Validating primary data against secondary sources is the single best defense against confusing correlation with causation. If your survey says demand is growing but BLS employment data shows the sector is contracting, that conflict is a finding, not an error to ignore.
- Document what the data does not prove. Every research project has limits. Explicitly stating what your data cannot confirm builds credibility with sophisticated stakeholders and protects you when findings are challenged.
Pro Tip: Set your analytical thresholds before you see the data, not after. Decide in advance what confidence level and effect size you will treat as meaningful. Researchers who set thresholds after seeing results unconsciously move the goalposts to confirm what they hoped to find.
For deeper analytical frameworks, advanced market analysis approaches cover regression modeling, scenario analysis, and competitive benchmarking techniques that extend well beyond basic descriptive statistics.
How to build strategies and present market insights effectively
Analysis that stays in a spreadsheet produces no return. The final stage of the market insights process is translating findings into decision-ready recommendations, and the format of that translation matters as much as the content.
Market analysis reports typically run 15 to 40 pages when combining primary and secondary research into a comprehensive view. That length is appropriate for the evidence section, but your stakeholders should never need to read 40 pages to understand what you recommend. The most effective structure leads with one page of strategic implications, followed by supporting evidence, with detailed data confined to appendices.
Key principles for presenting findings:
- Lead with the decision, not the data. Your first page should answer: “What should we do, and why?” Evidence follows. Stakeholders who want the detail will find it in the appendices.
- Link every insight to a specific action. “The market is growing at 8% annually” is an observation. “The 8% growth rate supports increasing sector allocation by 5 percentage points before Q3” is an insight. Effective presentations connect findings directly to decision points rather than overwhelming stakeholders with raw data.
- Define success metrics upfront. Before presenting, agree on what a “good” outcome looks like. This prevents post-presentation debates about whether findings are significant.
- Be transparent about confidence levels. State clearly which findings are based on statistically significant primary data, which are directional signals from secondary sources, and which are informed hypotheses requiring further validation.
- Avoid the data dump trap. A 40-page report with no executive summary and no clear recommendation is not a deliverable. It is a liability.
For financial professionals comparing multiple market opportunities, a structured approach to comparing financial markets helps frame findings within a consistent analytical lens across asset classes.
Common challenges in the market insights process
Even well-designed research projects hit obstacles. Knowing the most common failure points in advance lets you build safeguards into your process from the start.
- Over-reliance on a single source. A survey that shows strong demand means little if BLS data shows the labor pool for that sector is shrinking. Data triangulation is the best guardrail against single-source errors. Always cross-validate primary findings against at least one independent secondary source.
- Conflicting data signals. When sources disagree, the conflict itself is a finding worth reporting. Investigate the methodological differences between sources before deciding which to weight more heavily.
- Small or biased samples. A survey of 80 respondents drawn from your existing customer base is not a market study. It is a customer satisfaction check. Adjust your claims to match your actual sample, and flag limitations explicitly.
- Outdated data. Market conditions in sectors like digital assets, semiconductors, and renewable energy can shift materially within six months. Build a review cadence into your research plan so findings are refreshed before major decisions.
- Scope creep. Research projects that start with three questions and end with fifteen produce unfocused reports. Protect your original scope, and log new questions as candidates for the next research cycle rather than expanding the current one.
Monitoring live market data alongside your research cycle helps catch timing mismatches early. Tools that track real-time market movements across asset classes give you an ongoing signal that your research findings are still current.
Key takeaways
A structured market insights process produces better investment decisions because it forces clarity at every stage, from question definition through stakeholder presentation.
| Point | Details |
|---|---|
| Start with precise questions | Vague research questions produce unfocused findings that cannot drive investment decisions. |
| Use federal data first | Census Bureau, BLS, and FRED datasets provide free, credible baselines before primary research begins. |
| Triangulate every finding | Cross-validate primary data against secondary sources to avoid single-source errors and false correlations. |
| Lead presentations with strategy | Open with one page of implications; move detailed data to appendices to respect stakeholder time. |
| Document limitations explicitly | Stating what your data does not prove builds credibility and protects findings from challenge. |
Why structured market research has become non-negotiable
At Handy, we have watched financial professionals make the same mistake repeatedly: they treat market research as a one-time event rather than a continuous discipline. A sector analysis completed in January is not the same asset in September, particularly in markets where regulatory shifts, interest rate moves, and competitive entries can reshape the picture within a quarter.
What we find most underused is the combination of federal secondary data with targeted primary research. Most teams do one or the other. The teams that do both, and then triangulate the results, consistently produce findings that hold up under scrutiny. The Census Bureau’s County Business Patterns data, paired with 200 well-designed survey responses and a handful of expert interviews, gives you a market picture that neither source could produce alone.
The presentation problem is equally real. We have seen genuinely strong research fail to influence decisions because it was delivered as a data appendix rather than a strategic argument. The one-page implications format is not a shortcut. It is a discipline that forces the researcher to decide what actually matters before walking into the room.
The market insights process is not glamorous work. It is methodical, sometimes tedious, and full of moments where the data refuses to say what you hoped it would. That friction is the point. The process exists to replace hope with evidence, and evidence is what separates confident decisions from expensive guesses.
Stay ahead with real-time market data from Handy.Markets
The research process does not end when your report is filed. Markets move, and the insights that informed last quarter’s allocation may need updating before next quarter’s review.
Handy.Markets gives market researchers and financial professionals live prices and alerts across crypto, stocks, forex, commodities, indices, and ETFs in one place. You can set instant price alert notifications through Telegram, Discord, Slack, SMS, Webhook, or Email, so you catch the movements that matter without watching screens all day. When your research identifies a key price threshold or a sector signal worth monitoring, Handy turns that insight into an active alert in minutes.
FAQ
What is the first step in the market insights process?
The first step is defining a precise, decision-aligned research question. Vague questions produce unfocused data; every subsequent stage of the process depends on the clarity established here.
How many survey responses do you need for reliable market research?
150 to 400 survey responses are generally sufficient for reliable quantitative insights. Below 150 responses, confidence intervals widen enough to make findings difficult to defend to stakeholders.
Why is data triangulation important in market analysis?
Triangulation cross-validates primary findings against independent secondary sources, which protects against confusing correlation with causation. A single data source, no matter how credible, can produce misleading conclusions without corroboration.
How long should a market analysis report be?
Comprehensive market analysis reports typically run 15 to 40 pages when combining primary and secondary research. The strategic implications section should fit on one page; detailed evidence belongs in appendices.
What are NAICS codes and why do they matter?
NAICS codes are six-digit industry classification codes used to query federal datasets like Census Bureau and BLS data. Using incorrect or missing codes produces inaccurate market sizing and flawed competitor analysis.