
TL;DR:
- Crypto market trends are driven by liquidity, institutional activity, and macroeconomic signals rather than news cycles alone. Investors should analyze structural factors, including derivatives and on-chain data, to anticipate moves before headlines confirm them. The involvement of large institutions and ETF flows has reduced volatility but increased systemic risks, making comprehensive analysis essential.
Crypto market trends are defined by the interaction of liquidity conditions, investor positioning, and macroeconomic forces, not by news cycles or technology narratives alone. Explaining crypto market trends accurately means recognizing that Bitcoin, Ethereum, and the broader digital asset class now respond to the same global risk signals as equities and commodities, but with greater speed and amplitude. In 2026, institutional players like BlackRock and Nomura have deepened their exposure through ETFs and treasury allocations, fundamentally changing how these markets move. Understanding those structural shifts is the foundation of any serious crypto market analysis.
What fundamental factors drive crypto market trends?

Price movements in crypto are primarily driven by liquidity, positioning, and order flow, not by news or fundamental narratives alone. Markets tend to move before headlines appear. The headlines that follow often only validate moves that were already underway. This is one of the most misunderstood dynamics in cryptocurrency market fluctuations, and getting it right separates reactive traders from prepared ones.
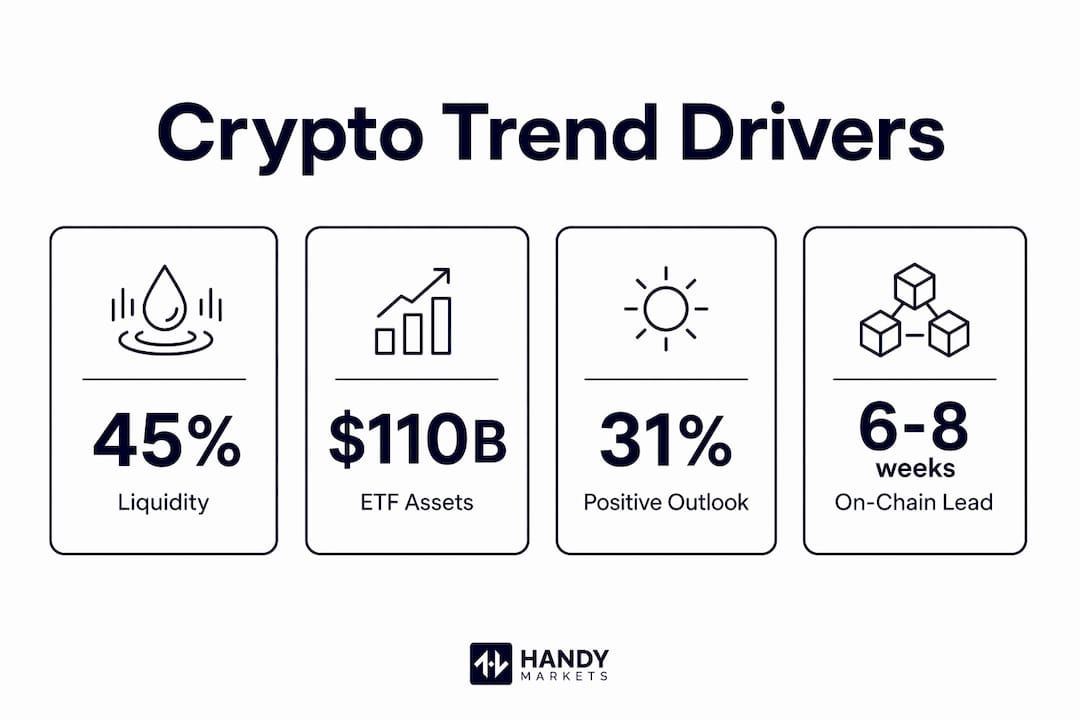
Four structural forces consistently shape price direction:
- Liquidity conditions: When market liquidity is thin, even moderate buy or sell pressure produces outsized price swings. Crypto’s 24/7 trading cycle means liquidity can drain rapidly during off-hours or holiday periods.
- Investor positioning and order flow: Large concentrations of leveraged long or short positions create predictable pressure points. When those positions unwind, the resulting moves can be violent and fast.
- Derivatives and liquidation cascades: In June 2026, Bitcoin fell below $70,000 and triggered $766 million in liquidations, mostly from leveraged longs. BTC’s market cap dropped 5% within 24 hours to $2.32 trillion. That event was not caused by news. It was caused by overleveraged positioning meeting a liquidity gap.
- Macroeconomic triggers: Interest rate expectations, dollar strength, and global risk sentiment act as immediate catalysts that amplify or suppress the underlying positioning dynamics.
Positioning often occurs before price moves are widely visible or justified by news. This means that by the time a trend is obvious to most observers, the structural move is already maturing. Traders who wait for confirmation from media coverage are consistently entering late.
Pro Tip: Before reacting to a crypto price drop, check open interest and funding rates on derivatives platforms. If funding was deeply positive before the drop, the move is likely a positioning flush, not a structural reversal.
How have institutional investors and ETFs changed crypto market behavior?
The crypto market in 2026 shows reduced volatility, longer market cycles, and more institutional involvement replacing the retail-driven chaos of earlier years. This shift is not cosmetic. It reflects a genuine change in who holds crypto, how they hold it, and how they respond to price moves.
| Metric | 2026 Data | Market Implication |
|---|---|---|
| Bitcoin ETF assets | ~$110 billion | Institutional capital now anchors BTC price floors |
| Ethereum ETF assets | Over $20 billion | ETH gains legitimacy as a portfolio allocation |
| Positive institutional sentiment | 31% (up from 25%) | Growing conviction reduces panic selling |
| Stablecoin market cap | Nearly $300 billion | Deep liquidity infrastructure supports market stability |
Institutional sentiment toward crypto increased in Q2 2026, with 31% of institutional investors holding positive outlooks, up from 25% previously. That shift in conviction means more patient capital sitting in the market, which naturally dampens the extreme volatility that characterized earlier cycles. Visa, Mastercard, and PayPal integrating stablecoins into payment systems further deepens the liquidity infrastructure underpinning crypto markets.
However, institutional scale also introduces new risks. Massive BTC holdings by digital asset treasury companies introduce systemic risks that could amplify bear markets through forced selling under margin pressure. A correction combined with an external shock could convert a normal pullback into a prolonged bear market if large holders face simultaneous margin calls. This is a structural vulnerability that did not exist when retail dominated the market.
Pro Tip: Track the balance sheets of major digital asset treasury companies alongside BTC price action. When their stock prices diverge sharply from BTC, it can signal stress in their leveraged positions before the broader market reacts.
How do global macro events and geopolitical risks shape crypto trends?
Crypto acts as a liquidity-sensitive mirror of global macro conditions, often reacting more sharply than traditional equities to geopolitical volatility and interest rate changes. This is not a coincidence. Crypto’s continuous trading and its global, borderless nature make it the first market where risk appetite changes get priced in, sometimes hours before equity markets open.
Several macro forces consistently influence crypto price direction:
- Interest rate expectations: When the Federal Reserve signals tighter monetary policy, risk assets sell off. Crypto, with its high beta to risk sentiment, typically leads that selloff.
- Dollar strength: A rising US dollar compresses crypto prices because most crypto assets are dollar-denominated. Dollar weakness, conversely, tends to support crypto rallies.
- Geopolitical shocks: Tensions in the Strait of Hormuz in 2026 triggered immediate crypto liquidations. Bitcoin’s $70,000 price level became a critical support and resistance zone during that period, with its reclaim on closing prices signaling a shift from damage control to recovery.
- Equity market correlation: During risk-off rotations, crypto and equities often sell off together. During risk-on periods, crypto tends to outperform because of its higher volatility profile.
“Crypto is now treated less like a speculative belief and more as integrated market infrastructure responding instantly and predictably to macroeconomic changes.” — Bitget News, 2026
Professional traders use BTC’s closing prices at key support levels as signal markers for transitioning from damage control to recovery phases, regardless of volatile intraday moves. This approach filters out noise and focuses on what the market is actually confirming over a full trading session. For investors reading market data trends in 2026, this closing-price discipline is one of the most practical tools available.
On-chain metrics add another layer of precision. The MVRV Z-Score and stablecoin deployment data provide 6 to 8 week advance signals for distinguishing between healthy corrections and structural bear markets. These metrics measure whether the market is trading above or below its realized value, giving investors a structural read that pure price charts cannot provide.
How does investor psychology affect reading crypto market trends?
Collective psychology cycles of fear and greed strongly influence crypto short-term price volatility and trader behavior. Sentiment amplifies moves, but it follows positioning rather than leading it. This distinction matters enormously for anyone trying to understand cryptocurrency trends without getting whipsawed by emotional reactions.
The most common psychological traps in crypto trading include:
- Mistaking news for cause: A negative headline during a selloff feels like the reason for the drop. In most cases, the positioning that caused the drop was already in place. The news is the story the market tells about a move that was already happening.
- Chasing sentiment extremes: When fear is at its peak, most of the selling is already done. When greed dominates, most of the buying has already occurred. Entering at sentiment extremes means buying high and selling low.
- Feedback loops: Rising prices attract more buyers, which pushes prices higher, which attracts more buyers. This loop works in reverse just as powerfully. Recognizing when you are inside a feedback loop is the first step to not being consumed by it.
Understanding market fluctuations through a psychological lens helps investors separate signal from noise. The psychology of long-term trading emphasizes patience and discipline as the core competencies that distinguish consistent performers from reactive traders. Sentiment tools like the Crypto Fear and Greed Index, combined with on-chain positioning data, give you a more complete picture than price action alone.
Key takeaways
Crypto market trends are driven by liquidity, institutional positioning, and macroeconomic forces, and reading them accurately requires structural analysis rather than headline-chasing.
| Point | Details |
|---|---|
| Liquidity drives price sensitivity | Thin liquidity amplifies moves; monitor conditions before entering positions. |
| Institutional capital reshapes cycles | $110B in Bitcoin ETFs lengthens market cycles and reduces extreme volatility. |
| Macro events trigger faster reactions | Crypto responds to geopolitical and rate signals faster than traditional assets. |
| Sentiment follows positioning | Fear and greed amplify moves but do not cause them; positioning comes first. |
| On-chain metrics signal early | MVRV Z-Score and stablecoin flows provide 6 to 8 week advance warnings. |
What we’ve learned from watching crypto markets mature
At Handy, we’ve spent considerable time watching how the narrative around crypto has evolved, and the most striking shift is not the price levels. It’s the quality of the questions investors now ask. In 2021, the dominant question was “which coin will 10x?” In 2026, the questions we see are about macro correlation, ETF flows, and on-chain positioning. That’s a meaningful sign of market maturation.
The trap we see most often is investors who understand the structural drivers intellectually but still trade on headlines emotionally. Knowing that positioning drives price does not automatically stop you from panic-selling when Bitcoin drops 8% in a morning. The discipline gap between knowing and doing is where most returns are lost.
We also think the institutional narrative is genuinely double-edged. Yes, BlackRock and similar players bring stability and legitimacy. But they also bring concentration risk. When a single treasury company holds billions in BTC on leverage, the market’s behavior in a stress scenario becomes harder to predict. The risk management strategies that apply to institutional forex trading are increasingly relevant to crypto investors navigating this new environment.
Our practical advice: build your analysis around three layers. Start with macro conditions and risk appetite. Layer in on-chain positioning and derivatives data. Then use sentiment indicators as a timing overlay. Headlines are the last layer, not the first.
Stay ahead of crypto market moves with Handy.Markets
Tracking crypto market trends in real time requires more than checking prices once a day. Handy gives you live prices, percentage changes, and crypto price alerts for Bitcoin, Ethereum, and hundreds of other digital assets, all in one place.
Set up instant alerts via Telegram, Discord, Slack, SMS, or Email so you never miss a critical price level. Whether you’re watching Bitcoin’s $70,000 support zone or tracking Ethereum ETF momentum, Handy’s alert system puts the signal in your hands the moment it matters. You can also monitor all financial markets including stocks, forex, commodities, and indices alongside your crypto positions, giving you the macro context that serious crypto analysis demands. Start monitoring smarter today.
FAQ
What are the main drivers of crypto market trends?
Crypto market trends are primarily driven by liquidity conditions, investor positioning, and macroeconomic factors like interest rates and geopolitical events. News and narratives typically validate moves that were already underway rather than causing them.
How do Bitcoin ETFs affect overall crypto market behavior?
Bitcoin ETFs now hold approximately $110 billion in assets, which introduces more patient institutional capital into the market and reduces the extreme volatility associated with retail-dominated cycles. However, large concentrated holdings also create systemic risk if forced selling occurs simultaneously.
How can I read crypto charts more effectively?
Focus on closing prices at key support and resistance levels rather than intraday moves, since professional traders use closing prices as signal markers for trend confirmation. Combine price chart analysis with on-chain metrics like the MVRV Z-Score for a more complete structural read.
What macro indicators should crypto investors watch?
Monitor Federal Reserve interest rate signals, US dollar strength, and equity market risk sentiment, as crypto reacts to all three faster than most traditional assets. Geopolitical events that affect global liquidity, such as tensions in major shipping corridors, also trigger rapid crypto price responses.
How does investor sentiment influence crypto price movements?
Sentiment cycles of fear and greed amplify existing price moves but follow underlying positioning rather than creating it. Entering trades at sentiment extremes, when fear or greed is at its peak, typically means buying high or selling low.
Recommended
- Market Data Trends In 2026: Guide For Traders | Handy.Markets
- Top Investment Strategies To Maximize Returns In 2026 | Handy.Markets
- Market Analysis Techniques 2026: Advanced Approaches For Analysts | Handy.Markets
- Mastering Volatility In Investing: A Beginner’s Guide To Navigating Market Swings In 2025 | Handy.Markets