TL;DR:
- A structured checklist helps retail investors evaluate stocks thoroughly and remain disciplined.
- Understanding the business model and key financial metrics is essential before investing.
- Combining fundamental analysis with technical timing improves confident, low-regret trading decisions.
Without a structured approach, even experienced retail investors skip critical steps before buying a stock, and those gaps can be costly. Missing key pre-investment checks increases risk and clouds judgment right when clarity matters most. A checklist changes that. It gives you a repeatable framework that keeps emotions in check and ensures every important factor gets evaluated before you commit capital. Think of it as your personal quality control system, one that separates disciplined investors from reactive ones. In this guide, we break down the essential stock analysis checks you need, from understanding the business to reading chart patterns, so you can trade with more confidence and fewer regrets.
Table of Contents
- Understand the business before you invest
- Analyze key financial metrics and statements
- Evaluate valuation ratios and risk indicators
- Check technical patterns and time your entry
- Our take: Why most checklists fail (and how yours won’t)
- Take your next step with real-time tools
- Frequently asked questions
Key Takeaways
| Point | Details |
|---|---|
| Know the business | Never invest without grasping how a company makes money and who its competitors are. |
| Check core metrics | Review revenue growth, profit margins, and free cash flow to reveal financial health. |
| Compare risk and value | Use ratios like P/E and beta to measure risk and judge market valuation. |
| Time your trades | Layer technical analysis on fundamentals to find the best buy and sell moments. |
| Customize your checklist | Treat your checklist as a living document, adapting as you learn with each investment. |
Understand the business before you invest
Before you look at a single number, ask yourself one question: can you describe what this company does in one sentence? If the answer is no, that is already a red flag worth paying attention to. Knowing the business model is the foundation of every smart investment decision, and skipping this step is how investors end up holding stocks they do not truly understand.
Start by identifying the company’s main revenue sources. Does it sell physical products, offer subscription services, or earn from advertising? Each model carries different risk and growth dynamics. A software company with recurring subscription revenue, for example, is far more predictable than a retailer dependent on seasonal demand. Understanding where the money comes from tells you a lot about how stable or volatile that income stream might be.
Next, look at the competitive landscape. Who are the company’s main rivals, and what is its market share? A business with a clear competitive advantage, whether that is brand loyalty, proprietary technology, or cost leadership, tends to be more resilient when markets get choppy. When you can compare financial markets and sector dynamics side by side, patterns become much easier to spot.
Here is a simple business evaluation checklist to run through before moving on:
- Can you explain the business model in plain language?
- Are revenue sources diversified or concentrated in one area?
- Does the company have a durable competitive advantage?
- Is the industry growing, stable, or declining?
- Who are the top three competitors, and how does this company compare?
“If you can’t explain it simply, you don’t understand it well enough to invest in it.” This principle applies directly to stock selection. Clarity at the business level protects you from costly misunderstandings later.
Aligning this understanding with top investment strategies helps you filter out businesses that look attractive on the surface but lack the fundamentals to support long-term growth. Knowing the business is not a formality. It is your first real line of defense.
Analyze key financial metrics and statements
Once you know what the company does, dive into the numbers that reveal its true financial condition. Three core statements form the backbone of any solid analysis: the income statement, the balance sheet, and the cash flow statement. Each tells a different part of the story, and together they give you a complete picture of financial health.
Here is what to focus on in each:
- Income statement: Look at revenue growth over the past three to five years. Consistent growth signals demand. Also check gross margin, which shows how efficiently the company turns revenue into profit before overhead costs.
- Balance sheet: Review total debt versus total equity. A company drowning in debt has less flexibility during downturns. Look for a manageable debt-to-equity ratio relative to its industry.
- Cash flow statement: Free cash flow is often called the “truth teller” of financial statements. Positive and growing free cash flow means the business generates real money, not just accounting profits.
As a reference point for healthy metrics, here is a simplified benchmark table:
| Metric | Healthy range (general) | Red flag |
|---|---|---|
| Revenue growth | 8% or more annually | Declining for 2+ years |
| Gross margin | 40%+ (software), 20%+ (retail) | Consistently shrinking |
| Free cash flow | Positive and growing | Negative for 3+ years |
| Debt-to-equity | Below 1.5 | Above 3.0 |
Pro Tip: Do not analyze these numbers in isolation. Review financial statements across income, balance, and cash flow, and always compare them to S&P 500 industry benchmarks for the relevant sector. A 15% gross margin might be excellent in grocery retail but alarming in software.

You can pull real-time financial data and live stock quotes to cross-reference these figures quickly. Staying current matters because a company’s financial picture can shift fast, especially around earnings season. Tracking market trends strategy alongside financials helps you understand whether a company’s numbers reflect broader sector momentum or an isolated performance.
Evaluate valuation ratios and risk indicators
Financial health is only part of the equation. Now you need to determine whether the stock is a bargain, a risk, or both. This is where valuation ratios and risk indicators come in, and they are some of the most practical tools in your checklist.
Let’s start with the three you should always check:
- Price-to-earnings (P/E) ratio: This tells you how much investors are paying for every dollar of earnings. A high P/E can mean the market expects strong future growth, or it can mean the stock is overpriced. Context matters. Check the P/E ratio against industry peers, not just the broader market.
- Beta: Beta measures how much a stock moves relative to the overall market. A beta above 1.0 means the stock is more volatile than the market. A beta below 1.0 suggests it moves more quietly. Knowing your risk appetite helps you decide whether a high-beta stock fits your portfolio.
- Dividend yield: For income-focused investors, dividend yield shows how much a company pays out relative to its share price. A yield that looks unusually high can sometimes signal financial stress, not generosity.
Here is a quick comparison of how these metrics might look across three hypothetical stocks:
| Stock | P/E ratio | Beta | Dividend yield |
|---|---|---|---|
| Stock A | 18x | 0.85 | 2.4% |
| Stock B | 42x | 1.60 | 0.3% |
| Stock C | 11x | 0.60 | 4.1% |
Stock A looks balanced. Stock B carries high growth expectations and higher volatility. Stock C appears conservative, possibly value-oriented. None of these is automatically better. The right choice depends on your goals.
Using essential market indicators alongside these ratios sharpens your read on the market environment. And if you want broader context, learning to track stock indices helps you benchmark individual stocks against the market’s overall direction.
Check technical patterns and time your entry
When you have narrowed down what to buy, the final checkpoint is deciding the most strategic time to act. This is where technical analysis earns its place in your checklist. Fundamentals tell you what to buy. Technicals help you figure out when.
Three core concepts anchor basic technical analysis:
- Support and resistance levels: Support is a price floor where buying tends to pick up. Resistance is a ceiling where selling pressure often increases. Buying near support and avoiding entry near resistance is a simple but effective principle.
- Moving averages: The 50-day and 200-day moving averages are widely watched benchmarks. When a stock’s price crosses above its 200-day moving average, many traders interpret that as a bullish signal.
- Trend confirmation: Never rely on a single indicator. Layering technical analysis on top of fundamentals helps refine your buy and sell timing with much greater precision.
Here is a simple three-step process for timing your entry:
- Identify the trend: Is the stock in an uptrend, downtrend, or moving sideways? Buying into a confirmed uptrend reduces timing risk.
- Spot a breakout or pullback: Look for a price breaking above resistance on high volume, or a healthy pullback to a moving average in an uptrend.
- Wait for confirmation: One candle does not make a trend. Give the signal at least one to two days of follow-through before acting.
Pro Tip: Set up price alerts at key technical levels so you do not have to watch charts all day. When the stock reaches your target zone, you get notified and can act with intention rather than impulse.
Exploring a market indices guide can also help you understand whether the broader market environment supports your trade. And reviewing investment trend insights gives you a macro lens to pair with your chart-level analysis.
Our take: Why most checklists fail (and how yours won’t)
Here is something most investing guides will not tell you: the checklist is not the problem. The investor using it is. Most retail investors treat a checklist as a one-time template, something to follow once and then set aside. That is exactly where the process breaks down.
The best investors we study treat their checklist as a living document. After every trade, win or loss, they ask: what did I miss? What did I overweight? Over time, the checklist evolves. It starts reflecting real experience rather than generic advice.
Emotions are the biggest threat to any checklist. When a stock is surging and social media is buzzing, skipping steps feels harmless. It never is. Building a habit of running through every item, even when it feels unnecessary, is what separates disciplined investors from reactive ones.
We also recommend reviewing your approach to adapting for market volatility regularly, because the market environment changes, and your checklist should reflect that. Treat it as a flexible toolkit, not a rigid script, and it will serve you far better over time.
Take your next step with real-time tools
You now have a structured checklist covering business fundamentals, financial metrics, valuation ratios, and technical timing. The next step is putting it to work with data you can actually trust in real time.
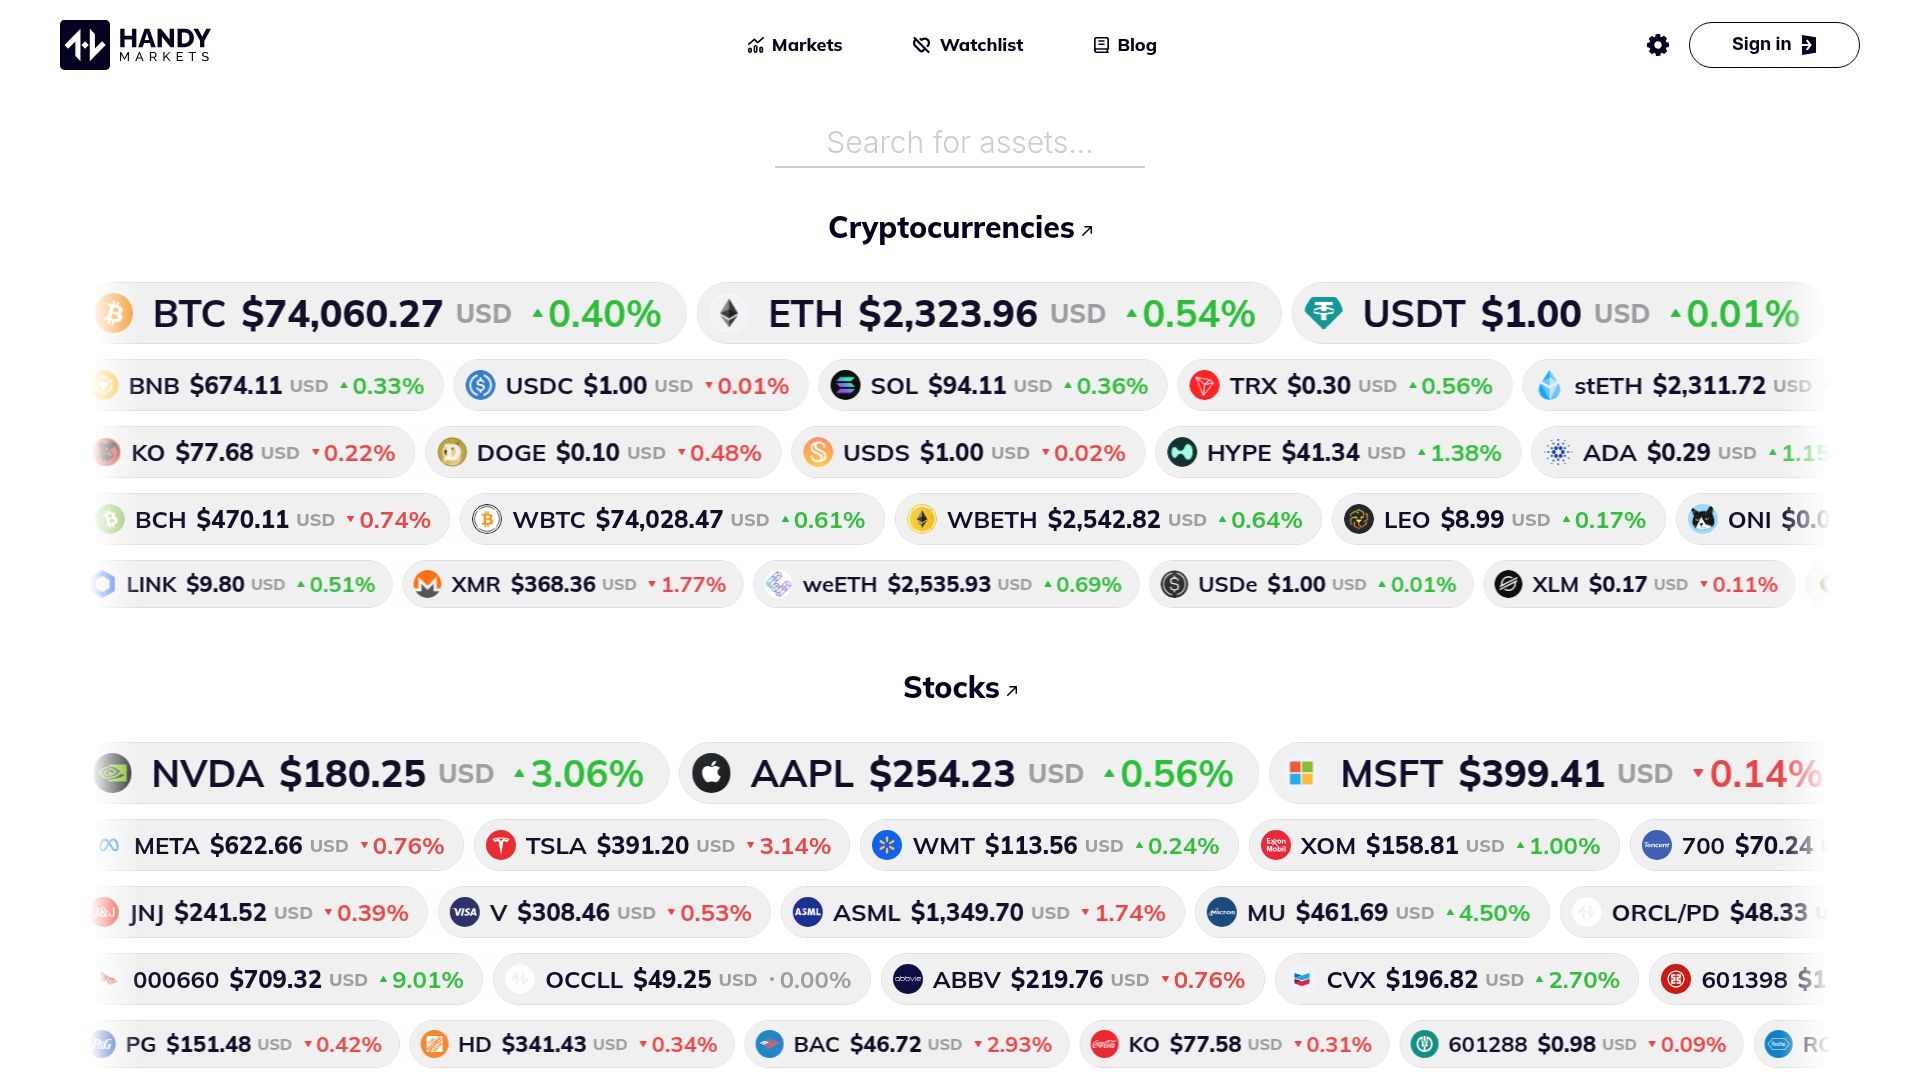
At Handy.Markets, we make that seamless. Access live stock quotes to run your financial checks instantly, and browse all market data across stocks, indices, commodities, and more in one place. Most importantly, set price alerts at your key technical levels across Telegram, Discord, Slack, SMS, and email so your checklist works even when you are not watching the screen. Disciplined investing starts with the right information at the right moment.
FAQ
What are the five essential checks before buying a stock?
The five key checks are understanding the business model, reviewing the P/E ratio, checking beta for risk, analyzing the dividend yield, and reviewing chart patterns for entry timing.
How do I quickly judge if a stock is fairly valued?
Compare its P/E ratio to industry peers and cross-reference with valuation metrics such as dividend yield and price-to-book ratio for a fuller picture.
Why do checklists help reduce emotional investing?
A checklist enforces structure, and checklists prevent impulsive emotional mistakes by ensuring every critical step is covered before you commit to a trade.
How much time should I spend analyzing a single stock?
Professional frameworks suggest 5 to 10 hours per stock for thorough analysis, though a focused checklist approach can help you work more efficiently within that range.