
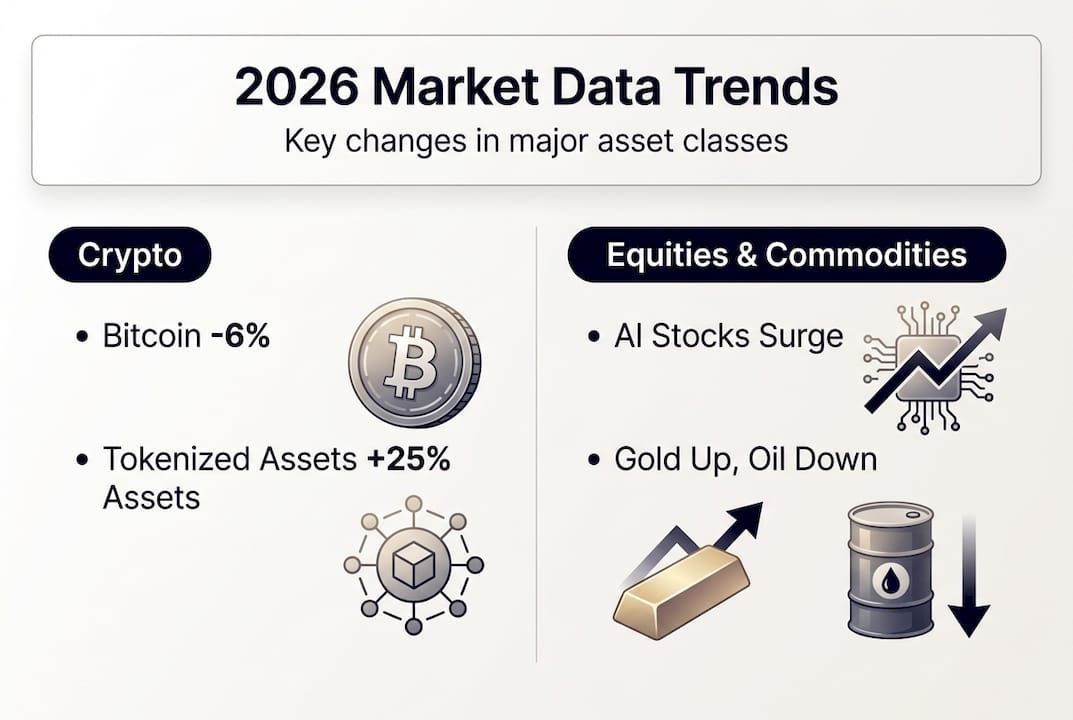
Market data in 2026 reveals unexpected shifts that challenge conventional investment wisdom. Bitcoin’s dominance has declined below previous peaks while stock valuations hover near historic highs, creating a complex landscape for traders. Commodities show stark divergence, with metals climbing as oil retreats. These contrasting trends demand fresh analytical frameworks. Understanding how tokenization, ETFs, and sector rotation reshape traditional correlations becomes essential for capitalizing on emerging opportunities while managing heightened volatility across cryptocurrencies, equities, and alternative assets.
Table of Contents
- Key takeaways
- The evolving landscape of cryptocurrency markets
- Stock market valuation and sector rotation dynamics
- Commodities and alternative assets: Divergent trends and market implications
- Navigating risks and opportunities in volatile markets
- Stay ahead with handy.markets real-time alerts
- Frequently asked questions
Key Takeaways
| Point | Details |
|---|---|
| Bitcoin dominance falls | Bitcoin still leads as the largest crypto but its market share has weakened from peak levels in 2026, signaling maturation rather than weakness. |
| Stocks highly valued | US equities trade near all time highs with a shift toward cyclical and non US equities implying broader rotation risk and opportunity. |
| Metals rise oil fall | Divergent commodity trends show metals climbing while oil retreats, suggesting different inflation and demand dynamics across energy and metals markets. |
| Tokenization and ETFs | Tokenization of real world assets and growing ETF activity are reshaping correlations and attracting institutional capital into both crypto and traditional markets. |
The evolving landscape of cryptocurrency markets
Cryptocurrency markets in 2026 demonstrate maturation through institutional adoption and infrastructure expansion. Bitcoin retains its position as the dominant digital asset, yet its market share has contracted as investors explore alternative opportunities. This shift reflects growing sophistication rather than weakness in the flagship cryptocurrency.
Tokenization of real-world assets represents a transformative development, with the RWA sector expanding to $19 billion in total value. Traditional financial instruments now migrate onto blockchain infrastructure, bridging conventional finance with decentralized systems. Real estate, bonds, and commodities gain programmability and fractional ownership capabilities through tokenization. This convergence attracts institutional capital previously hesitant about pure cryptocurrency exposure.
Stablecoin liquidity metrics paint a picture of robust market health. Aggregate stablecoin supply reaches all-time highs, providing the dry powder necessary for rapid capital deployment during market opportunities. Enhanced liquidity reduces slippage for large transactions and supports deeper order books across exchanges. Traders benefit from tighter spreads and improved execution quality compared to previous cycles.
Bitcoin ETF dynamics introduce unprecedented supply-side pressure. Institutional products are projected to absorb more Bitcoin than miners produce, fundamentally altering traditional supply-demand calculations. This structural shift creates potential price support as available float diminishes. However, concentration risk emerges as large ETF holders gain outsized influence over market movements.
Key developments shaping cryptocurrency market data include:
- Reduced correlation between Bitcoin and altcoins following ETF launches
- Institutional custody solutions reaching $200 billion in assets under management
- Layer-2 scaling solutions processing 15 million daily transactions
- Regulatory clarity in major jurisdictions accelerating compliant product launches
- Cross-chain interoperability protocols enabling seamless asset transfers
| Metric | 2025 | 2026 | Change |
|---|---|---|---|
| Bitcoin dominance | 68% | 62% | -6% |
| Tokenized RWA value | $8B | $19B | +137% |
| Stablecoin supply | $145B | $178B | +23% |
| Daily DEX volume | $4.2B | $7.8B | +86% |
Pro Tip: Monitor stablecoin supply changes as a leading indicator for crypto market sentiment. Rising supply typically precedes accumulation phases, while declining supply often signals distribution.
Stock market valuation and sector rotation dynamics
Equity markets in 2026 present a paradox of strength and vulnerability. US stocks maintain global leadership, yet valuations approach extreme levels that historically precede corrections. The S&P 500 trades at a forward price-to-earnings ratio near 24x, substantially above the 20-year average of 17x. This premium reflects optimism about earnings growth but leaves limited margin for disappointment.
The Shiller cyclically adjusted price-to-earnings ratio exceeds 40, territory previously seen only during the dot-com bubble. This metric smooths earnings over a decade to eliminate cyclical distortions, making current readings particularly concerning. However, proponents argue that lower interest rates and improved corporate profitability justify higher multiples than historical norms would suggest.
Investor behavior shows notable rotation patterns. Capital flows increasingly favor cyclical sectors like industrials, materials, and financials over the technology growth stocks that dominated recent years. This shift reflects expectations for economic acceleration and rising interest rates. Non-US equities attract renewed attention as valuation gaps widen between American and international markets. European and emerging market stocks trade at discounts exceeding 30% to US counterparts on comparable metrics.

The implied equity risk premium calculation suggests markets hover near fair value despite elevated absolute multiples. This measure compares expected stock returns to risk-free Treasury yields, currently indicating roughly 4.76% of excess return potential. Fair value assessments provide little comfort during external shocks, however, as sentiment can rapidly override fundamental anchors.
Artificial intelligence continues driving market narratives and capital allocation. Companies demonstrating credible AI integration command premium valuations, while those lagging face investor skepticism. This dynamic concentrates gains in a narrow leadership group, creating fragility as market breadth deteriorates. The sustainability of AI-driven earnings growth remains hotly debated among analysts.
| Valuation Metric | Current Level | Historical Average | Premium |
|---|---|---|---|
| S&P 500 forward P/E | 24.0x | 17.2x | +40% |
| Shiller CAPE | 41.3x | 28.5x | +45% |
| Price-to-book ratio | 4.8x | 3.2x | +50% |
| Dividend yield | 1.4% | 2.1% | -33% |
Sector rotation opportunities for stock market data and trends analysis:
- Energy stocks benefit from geopolitical tensions despite weak oil prices
- Financial sector gains from steepening yield curve and loan growth
- Healthcare offers defensive characteristics with reasonable valuations
- Real estate faces headwinds from elevated rates but selective opportunities emerge
- Utilities provide income stability as volatility increases
Pro Tip: Track the equal-weighted S&P 500 versus the market-cap-weighted version. Widening divergence signals dangerous concentration in a few mega-cap stocks, often preceding broader market weakness.
For deeper analysis of equity positioning strategies, explore our investment analysis articles covering risk management frameworks.
Commodities and alternative assets: Divergent trends and market implications
Commodity markets exhibit unusual bifurcation in 2026. Precious metals demonstrate significant strength while energy prices soften, creating tactical opportunities for astute portfolio managers. Gold and silver rally on safe-haven demand as geopolitical tensions and inflation concerns persist. Industrial metals like copper gain support from infrastructure spending and green energy transitions.
Crude oil faces downward pressure despite supply constraints. Demand softness in major economies, increased efficiency, and renewable energy adoption combine to cap price appreciation. Natural gas shows regional variation, with European prices remaining elevated while North American markets find equilibrium. This energy complex weakness contrasts sharply with the strength in metals markets.
Tokenized commodity exposure expands investment accessibility. Blockchain-based representations of physical assets enable fractional ownership and 24/7 trading capabilities. Gold-backed tokens, oil futures derivatives, and agricultural commodity certificates trade on decentralized platforms. These innovations reduce barriers for retail investors while maintaining exposure to underlying physical markets.
Cryptocurrency correlation dynamics shift meaningfully. Bitcoin and major altcoins show reduced correlation following ETF launches, as institutional flows impact assets differently. This decoupling creates diversification benefits within crypto allocations. However, extreme market stress still triggers correlation spikes as liquidity concerns override individual asset fundamentals.
| Commodity | YTD Performance | Key Driver |
|---|---|---|
| Gold | +18% | Safe-haven demand, Fed policy uncertainty |
| Silver | +22% | Industrial demand, monetary hedge |
| Copper | +12% | Infrastructure spending, supply constraints |
| WTI Crude | -8% | Demand concerns, efficiency gains |
| Natural Gas | +3% | Regional supply-demand imbalances |
Key trends in commodity market data:
- Lithium and rare earth elements surge on electric vehicle demand
- Agricultural commodities face climate-driven volatility
- Platinum group metals benefit from hydrogen economy investments
- Coal prices decline as energy transition accelerates
Steps to capitalize on commodity divergence:
- Allocate 5-10% of portfolio to precious metals as inflation hedge
- Consider tactical energy underweights given structural headwinds
- Explore ETF market data for diversified commodity exposure
- Monitor industrial metals for cyclical economic signals
- Use commodity futures for portfolio hedging strategies
| Asset Class | Correlation to Stocks | Correlation to Bonds | Portfolio Role |
|---|---|---|---|
| Gold | -0.15 | -0.22 | Inflation hedge, crisis protection |
| Oil | 0.38 | -0.08 | Economic growth proxy |
| Bitcoin | 0.42 | -0.12 | Alternative store of value |
| Tokenized RWA | 0.28 | 0.15 | Diversification, yield generation |
For sophisticated approaches to metals allocation, review gold portfolio risk management strategies that address 2026-specific market conditions.
Navigating risks and opportunities in volatile markets
Market participants face competing narratives that create both danger and possibility. Bullish catalysts include AI-driven productivity gains and potential Federal Reserve easing if inflation moderates. Bearish concerns center on elevated valuations and inflation resurgence risks that could force tighter monetary policy. Successful navigation requires acknowledging both scenarios without anchoring to either extreme.
Concentrated market leadership presents systemic fragility. The top ten S&P 500 constituents represent over 30% of index value, the highest concentration in decades. This narrow breadth means reversals in a handful of mega-cap technology stocks can trigger broad market declines. Diversification beyond these leaders becomes essential despite their strong recent performance.
Inflation dynamics remain the critical variable for all asset classes. A resurgence above 4% would likely force central banks to maintain restrictive policies, pressuring both stocks and bonds. Conversely, successful inflation control enables easier monetary conditions that support risk assets. Commodity prices, wage growth, and housing costs provide early warning signals for inflation trajectory changes.
Geopolitical tensions add unpredictable volatility. Trade disputes, regional conflicts, and policy uncertainty create sudden market dislocations. These events often generate attractive entry points for patient investors with prepared capital. However, distinguishing temporary shocks from structural shifts requires careful analysis of underlying fundamentals.
Practical risk management strategies:
- Maintain 15-20% cash or short-term bonds for opportunistic deployment
- Use stop-loss orders on concentrated positions exceeding 5% of portfolio
- Diversify across asset classes with low or negative correlations
- Rebalance quarterly to maintain target allocations despite drift
- Avoid leverage in uncertain environments regardless of apparent opportunities
- Monitor credit spreads as leading indicators for equity market stress
“The challenge in 2026 is balancing justified optimism about technological progress with realistic assessment of valuation risk. Markets can remain expensive longer than logic suggests, but eventual mean reversion is inevitable. Position sizing and patience determine whether you profit from or suffer through the adjustment.”
Pro Tip: Watch the equity risk premium closely. When it falls below 3.5%, stocks offer inadequate compensation for their risks relative to bonds. Above 6%, equities become compelling despite absolute valuation concerns. Current levels near 4.76% suggest moderate attractiveness.
For comprehensive approaches to managing market swings, our guide on volatility management in investing provides actionable frameworks for traders at all experience levels.
Stay ahead with handy.markets real-time alerts
Market conditions in 2026 demand tools that match the speed and complexity of modern trading environments. Handy.markets delivers instant notifications across multiple channels when your tracked assets hit critical price levels. Whether monitoring INFINIT price alerts for cryptocurrency opportunities or tracking traditional equity movements, the platform ensures you never miss significant market shifts.
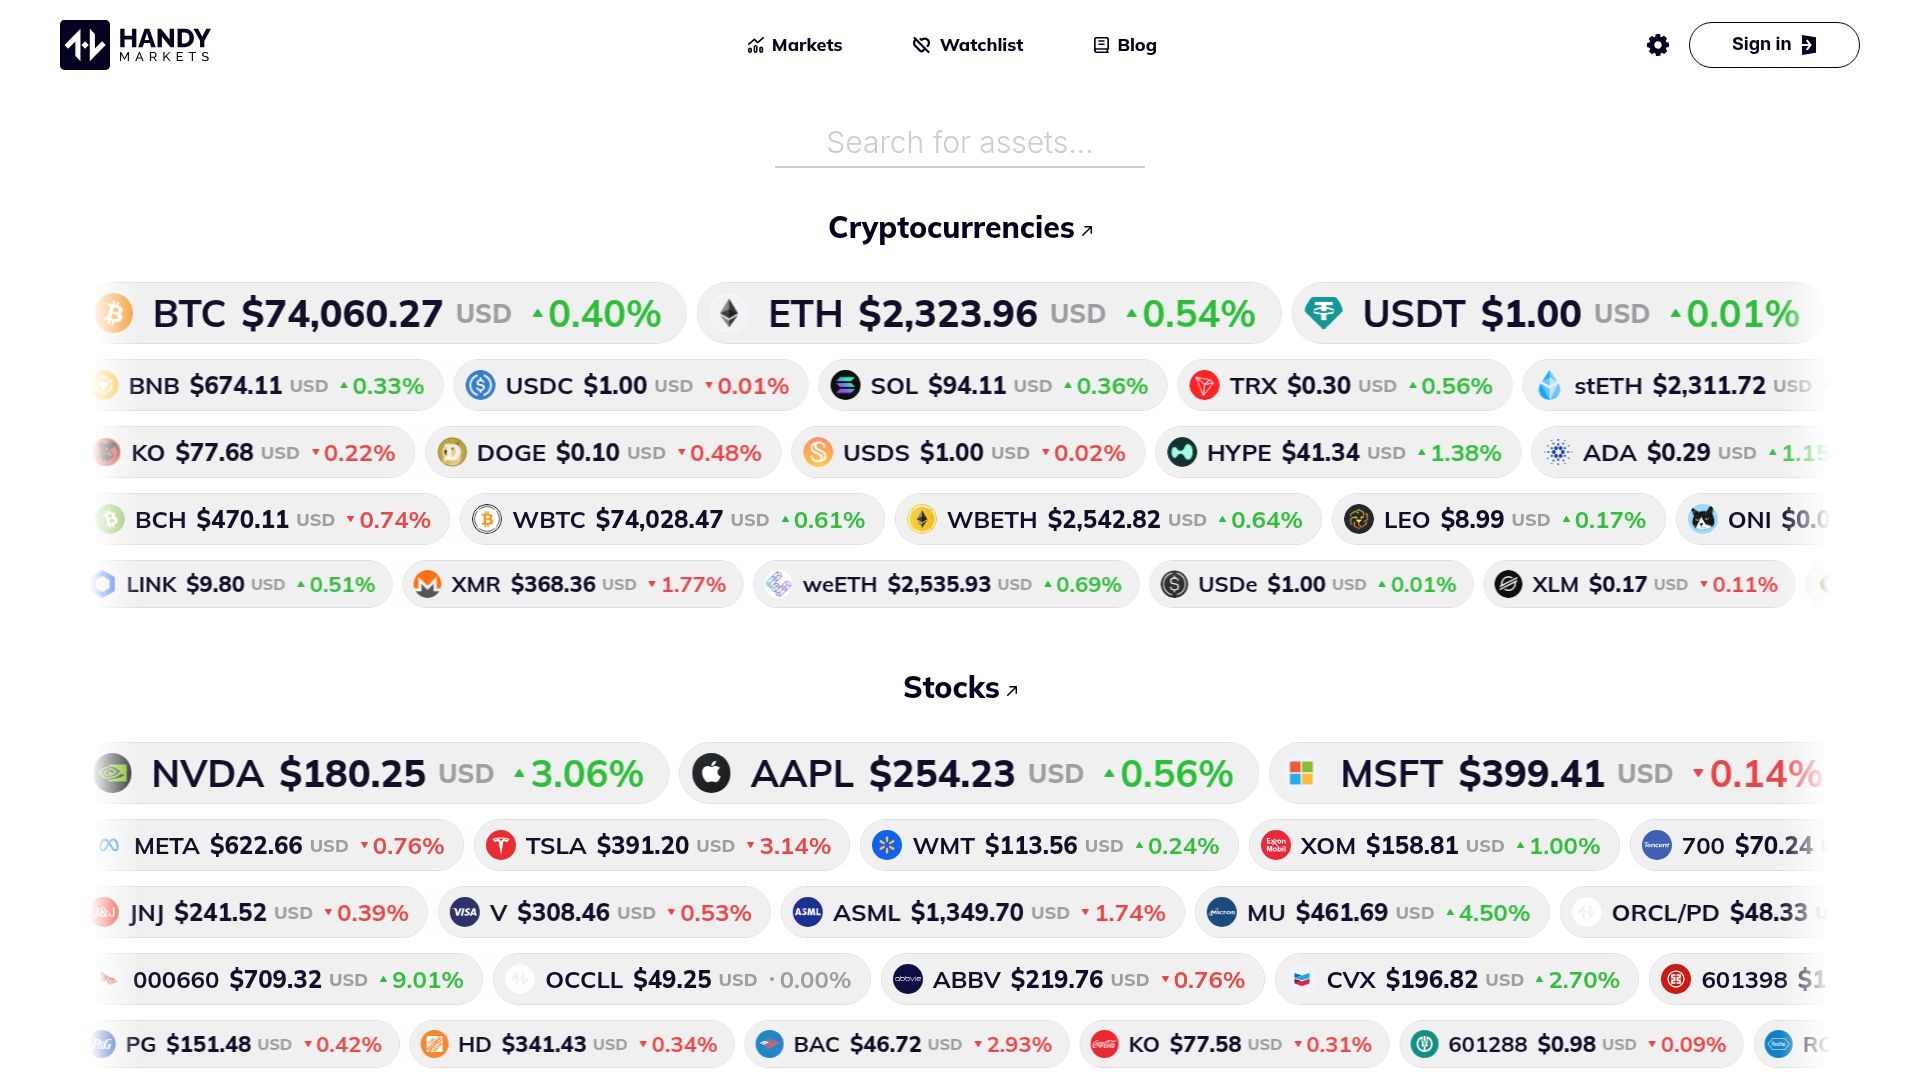
The platform aggregates live data across ETF market alerts, stocks, forex, and commodities in a single customizable dashboard. Set up alerts via Telegram, Discord, Slack, SMS, webhook, or email based on your workflow preferences. This flexibility means critical information reaches you through your preferred communication channel without constant manual monitoring.
Leverage these financial market tracking tools to implement the strategies discussed throughout this analysis. Real-time visibility into price movements, percentage changes, and volume patterns enables faster decision-making during volatile periods. Transform market insights into actionable trades with infrastructure built specifically for active traders and investors navigating 2026’s complex landscape.
FAQ
What factors led to Bitcoin’s reduced dominance in 2026?
The rise of tokenized real-world assets and increased stablecoin liquidity diversified the crypto market beyond Bitcoin’s traditional dominance. Introduction of Bitcoin ETFs paradoxically reduced its market share percentage as total crypto market capitalization expanded faster than Bitcoin alone. Institutional capital flowing into alternative blockchain applications and DeFi protocols further distributed value across the ecosystem. Improved infrastructure for altcoins made them more accessible to mainstream investors seeking higher risk-adjusted returns. Track these dynamics through cryptocurrency market data to identify emerging opportunities.
How do high stock valuations affect investment risk in 2026?
High forward P/E ratios near 24x and Shiller CAPE above 40 signal increased risk of market correction when earnings disappoint or interest rates rise unexpectedly. Elevated valuations leave minimal margin for error, meaning small negative surprises can trigger disproportionate price declines. Investors should monitor valuation indicators continuously to balance growth positions with defensive allocations. Consider increasing cash reserves and reducing position sizes in the most expensive sectors. Our investment risk articles provide frameworks for adjusting portfolio risk exposure based on valuation cycles.
What commodities are likely to outperform in 2026?
Precious metals like gold are poised for gains due to safe-haven demand amid geopolitical tensions and inflation concerns. Silver benefits from both monetary hedge characteristics and industrial applications in green energy technologies. Industrial metals including copper face supply constraints while infrastructure spending drives demand. Oil prices face downward pressure from efficiency improvements and renewable energy adoption despite geopolitical supply risks. Monitor commodity performance data to identify tactical entry points. For sophisticated metals strategies, explore gold investment strategies tailored to current market conditions.
How should investors balance AI optimism with valuation concerns?
Acknowledge AI’s genuine potential to drive productivity gains while recognizing that current stock prices already reflect substantial optimism. Diversify AI exposure across multiple companies and sectors rather than concentrating in a few mega-cap leaders. Monitor actual earnings growth and margin expansion to verify whether AI investments generate promised returns. Maintain exposure to AI beneficiaries but size positions conservatively given elevated valuations. Rebalance regularly to prevent AI holdings from dominating your portfolio through price appreciation alone.
What role do tokenized assets play in modern portfolios?
Tokenized real-world assets provide fractional ownership and enhanced liquidity for traditionally illiquid investments like real estate and private credit. They enable 24/7 trading and programmable features such as automated dividend distributions and governance rights. Correlation benefits emerge as tokenized assets often move independently from traditional stocks and bonds. However, regulatory uncertainty and custody risks require careful due diligence before significant allocation. Start with small exploratory positions to understand the technology and market dynamics before scaling exposure.
Recommended
- Mastering Volatility In Investing: A Beginner’s Guide To Navigating Market Swings In 2025 | Handy.Markets
- Financial Markets: Track Crypto, Stocks, Forex, Indices, Commodities & ETFs Prices With Alerts | Handy.Markets
- Financial Markets For Everyone | Handy.Markets
- Optimism (OP) Price Alerts & Chart | Set Instant Notifications | Handy.Markets
- Gold trading terminology: institutional guide 2026