TL;DR:
- Different indices are constructed with unique methodologies, influencing their market signals.
- Rebalancing adjusts index components periodically, affecting market movements and trading opportunities.
- Monitoring multiple indices provides a comprehensive view of market trends and enhances trading decisions.
Many traders assume that all financial indices do the same thing: mirror the market. It’s an understandable shortcut, but it’s also one of the most limiting beliefs you can carry into your trading practice. The reality is that each index is a distinct instrument, built with its own methodology, sector focus, and weighting logic. Financial indices are statistical measures tracking performance of a group of securities representing a market segment, calculated using weighted averages based on price, market cap, revenue, or fundamentals. Understanding how they actually work gives you a genuine edge in benchmarking, trend detection, and risk management.
Table of Contents
- What are financial indices and how do they work?
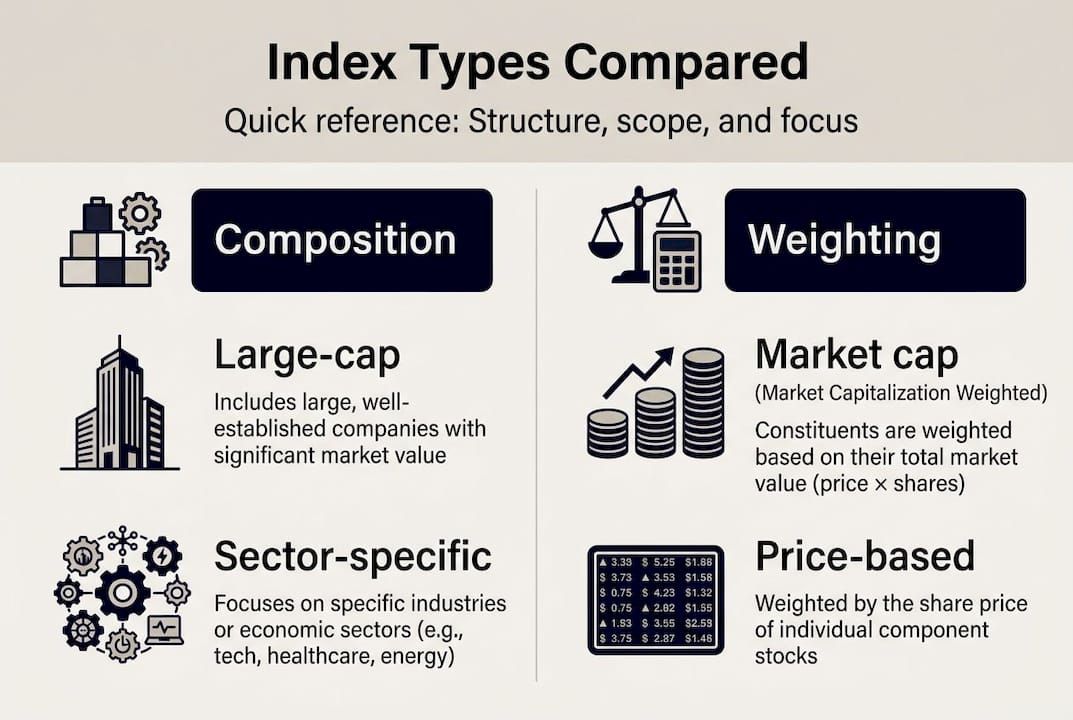
- Types of financial indices: A comparison
- How indices are maintained: The role of rebalancing
- Using financial indices for smarter trading decisions
- A seasoned trader’s perspective: Rethinking indices as market signals
- Turn market knowledge into real results
- Frequently asked questions
Key Takeaways
| Point | Details |
|---|---|
| Indices reveal market trends | Tracking multiple indices helps you spot broad market trends and sector shifts faster. |
| Construction matters | Understanding weighting and criteria gives clarity on what each index truly measures. |
| Rebalancing shifts the landscape | Index rebalancing can cause large, tradable swings in volumes and sector weights. |
| Index choice impacts benchmarks | Choosing the right indices is crucial for realistic performance tracking and risk management. |
What are financial indices and how do they work?
With the context set, let’s break down what defines a financial index and why its structure matters for your strategies.
A financial index is essentially a curated snapshot of a market or segment, designed to represent collective performance through a single number. Think of it as a scoreboard that tells you how a defined group of assets is doing at any given moment. But the way that scoreboard is calculated changes everything about what it actually tells you.
There are three main construction methods traders need to know:
- Price-weighted: Each stock’s influence is proportional to its share price. The Dow Jones Industrial Average (DJIA) uses this method, which means a $400 stock moves the index more than a $40 stock, regardless of company size.
- Market cap-weighted: Influence is based on total market value (share price multiplied by shares outstanding). The S&P 500 uses a float-adjusted version of this, meaning only publicly tradable shares count.
- Fundamentals-weighted: Some indices weight by revenue, earnings, or dividends rather than price or market cap, aiming to reduce the distortion caused by overvalued stocks.
The market index basics of each method shape what the index actually measures. For example, the Nasdaq Composite includes over 3,000 companies and leans heavily toward technology, making it a very different read on market health than the DJIA’s 30 blue-chip stocks.
Why does this matter to you as a trader? Because if you’re using the DJIA to gauge broad market sentiment, you might be reading a signal shaped more by a handful of high-priced stocks than by actual economic breadth. Understanding market indices as benchmarks helps you select the right tool for each analysis task.
Indices are also used for benchmarking portfolio performance, building index funds and ETFs, and as underlying assets for derivatives trading. They are the foundation of passive investing and a critical reference point for active traders.
Pro Tip: Before using any index as a benchmark for your portfolio, check its weighting method. A market cap-weighted index may overrepresent a few mega-cap stocks, which could skew your performance comparison.
Types of financial indices: A comparison
Now that you know how indices are built, let’s see how major types compare and what those differences mean for your market view.
Here’s a side-by-side look at the most widely followed indices:
| Index | Weighting method | Number of components | Primary sector focus | Geographic scope |
|---|---|---|---|---|
| DJIA | Price-weighted | 30 | Industrials, blue chips | U.S. |
| S&P 500 | Float-adjusted market cap | 500 | Broad U.S. equity | U.S. |
| Nasdaq Composite | Market cap-weighted | 3,000+ | Technology | U.S. |
| FTSE 100 | Market cap-weighted | 100 | Financials, energy | U.K. |
| Nikkei 225 | Price-weighted | 225 | Industrials, tech | Japan |
As the data shows, DJIA is price-weighted, S&P 500 is float-adjusted market cap-weighted, Nasdaq Composite has its own methodology, and each tells a different story about market conditions.
Knowing why use different indices is critical when you’re building a trading strategy. Here’s how to think about which index fits your goal:
- Gauging broad U.S. economic health: The S&P 500 is your go-to. Its 500 components and float-adjusted weighting give the widest and most representative view of U.S. equities.
- Tracking technology sector momentum: The Nasdaq Composite or Nasdaq-100 captures the pulse of tech-driven growth, making it essential for growth-oriented traders.
- Monitoring blue-chip stability: The DJIA reflects the performance of 30 established American companies, useful for tracking large-cap sentiment.
- International diversification signals: The FTSE 100 and Nikkei 225 offer windows into U.K. and Japanese market conditions, helping you spot global trends.
Using stock market indicators alongside these indices adds another layer of context, especially during volatile periods. The key insight here is that no single index captures everything. Each one has blind spots shaped by its methodology and component selection.
How indices are maintained: The role of rebalancing
Understanding index composition is just the start. Let’s dig into how indices stay relevant and effective for benchmarking through rebalancing.
Rebalancing is the periodic process of reviewing and adjusting an index’s components and their weights. Without it, indices would drift away from their intended purpose as markets evolve. Rebalancing involves periodic adjustments to weights and constituents, with the S&P 500 doing this quarterly through a review process that evaluates market cap, liquidity, and sector representation.

Here’s a quick look at rebalancing schedules for major indices:
| Index | Rebalancing frequency | Key criteria reviewed |
|---|---|---|
| S&P 500 | Quarterly | Market cap, liquidity, sector |
| DJIA | As needed | Committee discretion |
| Nasdaq-100 | Annually (special if needed) | Market cap, trading volume |
| FTSE 100 | Quarterly | Market cap ranking |
“Index rebalancing isn’t just administrative housekeeping. It’s a market event that moves real money, triggers sector rotations, and creates short-term trading opportunities for those paying attention.”
When a stock is added to a major index, index funds tracking that index must buy it, often driving the price up. When a stock is removed, the opposite can happen. These are predictable, calendar-driven events that active traders can prepare for.
You can track how indices change over time to spot patterns in how rebalancing affects specific sectors. For example, a surge in tech valuations might cause the sector’s weight in the S&P 500 to grow, prompting a rebalancing that shifts allocations and triggers volume spikes.
Pro Tip: Watch for S&P 500 rebalancing announcements, typically released a few days before they take effect. Stocks being added often see a short-term price bump as passive funds adjust their holdings. Using real-time market monitoring tools helps you catch these moves as they happen.
Using financial indices for smarter trading decisions
With a grasp of how indices are curated, let’s convert that knowledge into actionable strategies for your trades.
The S&P 500 has annualized roughly 10.42% over 100 years, while the FTSE 100 has historically lagged behind. That gap tells you something important: geography, methodology, and sector composition all affect long-term returns. Using this context helps you set realistic benchmarks for your own portfolio.
Here are the best practices for using indices effectively:
- Trend detection: Compare an index’s current level to its 50-day and 200-day moving averages. A sustained move above the 200-day average often signals a longer-term uptrend.
- Benchmarking your portfolio: If your portfolio underperforms the S&P 500 over 12 months, it’s worth asking whether active management is adding value or just adding cost.
- Risk management: Indices like the VIX (Volatility Index) measure expected market turbulence. When the VIX spikes, it often signals that traders are pricing in fear, which can be a cue to tighten risk controls.
- Sector rotation signals: When the Nasdaq outperforms the DJIA, growth stocks are likely leading. When the reverse happens, defensive or value stocks may be taking over.
Traders monitor indices for trends and benchmarks, but nuances like weighting biases affect the signals you get. That’s why using multiple indices together gives you a fuller, more reliable picture.
Common mistakes to avoid when tracking indices for strategy:
- Relying on a single index to represent the entire market
- Ignoring how an index’s sector concentration might bias your read on conditions
- Forgetting that index returns don’t account for fees, taxes, or trading costs
Pairing index data with market volatility strategies and following live market prices in real time gives you the most actionable view of where markets are heading.
A seasoned trader’s perspective: Rethinking indices as market signals
Most mainstream guides tell you to pick a benchmark and stick with it. We’d push back on that. Leaning on a single index is a form of confirmation bias dressed up as discipline.
Here’s the uncomfortable truth: every index has a built-in perspective shaped by its methodology. Market cap weighting means the biggest companies dominate the signal, so when mega-cap tech stocks surge, the S&P 500 can look bullish even when most of its 500 components are flat or falling. That’s not a market signal. That’s a distortion.
Experienced traders triangulate. They look at the S&P 500 for breadth, the Nasdaq for tech momentum, the Russell 2000 for small-cap health, and international indices for global context. Comparing financial markets across geographies and asset classes reveals divergences that a single index would hide entirely.
The traders who consistently outperform aren’t just watching more data. They’re asking better questions of the data they already have.
Turn market knowledge into real results
Ready to take your index know-how to the next level? Here’s how you can easily monitor, compare, and act on market signals every day.
At Handy.Markets, we built the platform for exactly this kind of active, multi-index monitoring. You can track financial markets across indices, stocks, crypto, commodities, and forex all in one place, with live prices and percentage changes updating in real time. Need to watch live stock quotes alongside global index movements? It’s all there, side by side. And when a critical level is approaching, you can set price alerts via Telegram, Discord, Slack, SMS, Webhook, or Email so you never miss the moment that matters. Smarter monitoring starts here.
FAQ
What is the difference between price-weighted and market cap-weighted indices?
Price-weighted indices give more influence to higher-priced stocks, while market cap-weighted indices are driven by each company’s total market value, making larger companies more influential regardless of share price.
How often are major indices like the S&P 500 rebalanced?
The S&P 500 is rebalanced quarterly, with a committee reviewing components based on market cap, liquidity, and sector criteria to ensure the index stays representative of the U.S. equity market.
Why do traders watch more than one financial index?
Each index has unique methodology-driven biases, so monitoring multiple indices helps traders identify genuine broad market trends rather than signals skewed by a single index’s weighting or sector concentration.
Do financial indices only include stocks?
No. While equity indices are the most widely followed in trading, some indices track bonds, commodities, real estate investment trusts, or currencies, giving investors benchmarks across virtually every asset class.
How do indices impact portfolio performance measurement?
Indices serve as benchmarks that let you compare your portfolio’s returns and risk profile against a defined market standard, helping you evaluate whether your strategy is genuinely adding value over time.