TL;DR:
- Volatility measures the magnitude of price swings, regardless of market direction.
- It is driven by information releases, geopolitical events, and market structure, not just market decline.
- Traders use real-time data and disciplined strategies to respond effectively to market fluctuations.
Most traders assume that volatility means one thing: prices are falling and danger is near. That assumption costs money. Volatility is directionless, measuring the magnitude of price swings regardless of whether markets are moving up or down. A market surging 3% daily is just as volatile as one dropping 3% daily. Understanding this distinction is not just academic. It shapes how you size positions, set alerts, and stay calm when others panic. This guide breaks down what volatility actually is, how it’s measured, what causes it, and how you can use that knowledge to make sharper, more confident trading decisions.
Table of Contents
- Defining market volatility: What it is and isn’t
- How volatility is measured: Key metrics and benchmarks
- What causes market volatility and its common triggers
- How volatility impacts trading and investing decisions
- A fresh perspective on market volatility
- Empower your trading with real-time market data from Handy.Markets
- Frequently asked questions
Key Takeaways
| Point | Details |
|---|---|
| Volatility measures movement | Market volatility tracks how much prices change, not just their direction. |
| Multiple metrics exist | Standard deviation, beta, and VIX are just a few ways to quantify and compare volatility. |
| Not always negative | High volatility creates both risk and opportunity, depending on your strategy. |
| Preparation is key | Using real-time data and alerts lets you respond effectively to market swings. |
Defining market volatility: What it is and isn’t
With the misconception addressed, let’s break down exactly what market volatility is and isn’t.
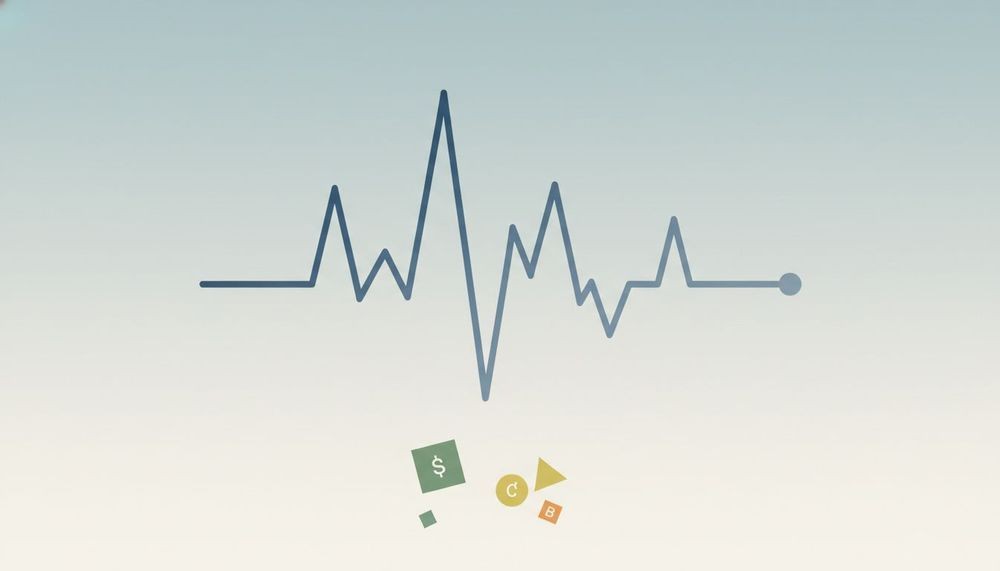
At its core, market volatility describes how much and how quickly prices change over a given period. Think of it as the heartbeat of a market. A slow, steady pulse means prices are moving calmly. A racing pulse means prices are jumping around fast, whether that’s upward or downward. As FINRA confirms, volatility measures price swing magnitude, not direction.
This is where many beginners go wrong. They conflate volatility with a bearish trend, assuming that a volatile market is always a losing market. But a stock that gains 4% on Monday, drops 3% on Tuesday, and gains 5% on Wednesday is highly volatile and trending upward. Volatility and trend are separate concepts entirely.
It’s also worth distinguishing volatility from two related but different ideas:
- Liquidity refers to how easily you can buy or sell an asset without moving its price. Low liquidity can amplify volatility, but they are not the same thing.
- Risk is a broader concept that includes the probability of a permanent loss of capital. Volatility is one input into risk, not the whole picture.
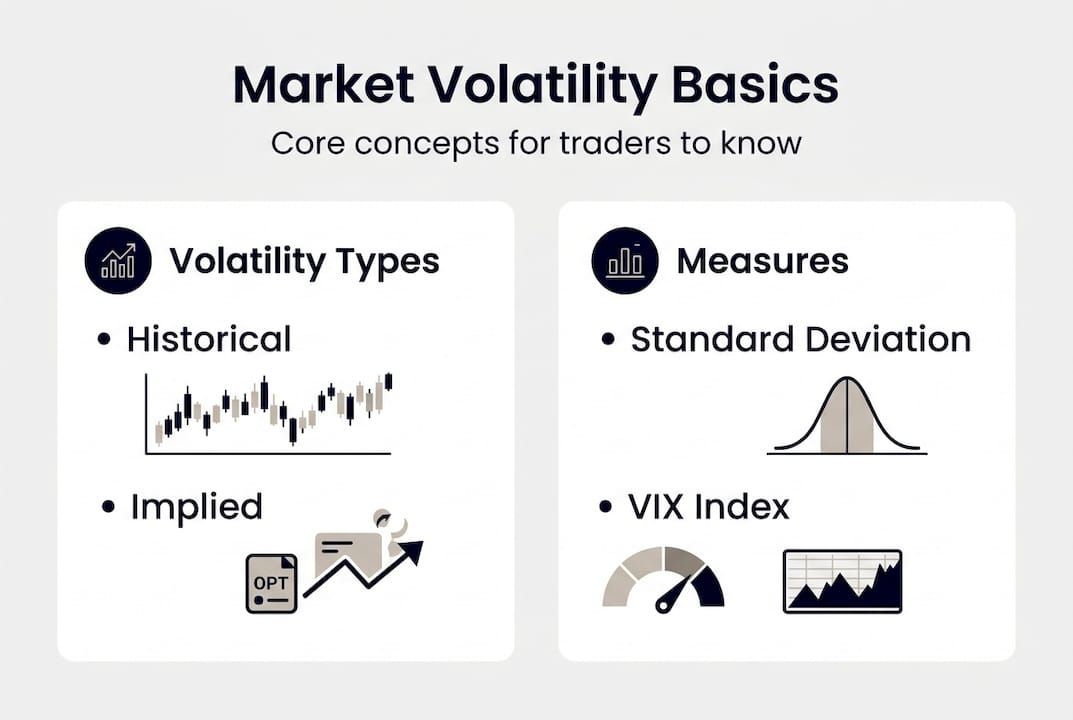
There are two main types of volatility you’ll encounter:
- Historical volatility (HV): Also called realized volatility, this measures how much an asset’s price actually moved over a past period, typically calculated using standard deviation of daily returns.
- Implied volatility (IV): This is forward-looking, derived from options pricing, and reflects what the market expects future price swings to look like.
“Volatility is not your enemy. It’s the condition that makes profitable trading possible. Without price movement, there is no opportunity.”
For traders navigating market swings, understanding whether you’re dealing with historical or implied volatility changes how you interpret signals. For investors, volatility is often noise to be tolerated rather than acted upon. And for those tracking forex volatility drivers, the picture gets even more nuanced, since currency pairs can swing sharply on central bank commentary alone.
How volatility is measured: Key metrics and benchmarks
Now that you know what volatility is, let’s see how it’s actually measured and tracked in markets.
Three metrics do most of the heavy lifting when it comes to quantifying volatility:
| Metric | What it measures | Best used for |
|---|---|---|
| Standard deviation | Spread of price returns around the average | Historical volatility of any asset |
| Beta | Asset’s price sensitivity relative to a benchmark index | Comparing stock volatility to the broader market |
| VIX | Expected 30-day volatility of the S&P 500, derived from options | Gauging overall market fear or complacency |
Standard deviation is the mathematical backbone of volatility analysis. A higher standard deviation means returns are more spread out, which means bigger price swings. Beta tells you how much a stock tends to move relative to the S&P 500. A beta of 1.5 means the stock typically moves 50% more than the index in either direction.
The VIX, often called the “fear gauge,” is arguably the most watched volatility benchmark in the world. When the VIX is below 15, markets are generally calm. Above 30, traders are nervous. But the VIX has its limits. A striking example: on August 5, 2024, pre-market VIX spiked to 65 due to illiquid out-of-the-money options contracts, before filtering algorithms corrected the extreme reading. That spike was partly a measurement artifact, not a pure reflection of true market fear.
This matters because blindly following the VIX without context can lead to poor decisions. The difference between historical and implied volatility also tells a story. When implied volatility is much higher than historical volatility, the market is pricing in fear that may not be justified by recent price action.
Pro Tip: Pair VIX readings with volatility analysis tools that show real-time price data across multiple assets. A single metric rarely tells the full story. Cross-referencing the VIX with individual asset beta and recent price ranges gives you a much clearer picture before you act. A solid volatility checklist can help you systematize this process.
What causes market volatility and its common triggers
To fully grasp market volatility, it’s crucial to know what stirs it and why it sometimes surges unpredictably.
Markets are driven by information. Any new data that changes expectations about future earnings, economic growth, or policy can trigger a repricing of assets. The faster and more surprising the information, the more violent the price reaction.
Here are the most common volatility triggers:
- Economic data releases: Reports like U.S. jobs numbers, CPI inflation data, or GDP growth figures can move markets sharply within seconds of release.
- Central bank decisions: Interest rate announcements from the Federal Reserve or the European Central Bank regularly cause spikes in equity, bond, and forex markets.
- Corporate earnings: A company missing or beating earnings estimates can send its stock up or down 10% or more in a single session.
- Geopolitical events: Wars, elections, trade disputes, and sanctions create uncertainty, which markets hate and price in quickly.
- Black swan events: These are rare, unexpected events with outsized impact. They are nearly impossible to predict but can send volatility soaring within minutes.
The August 5, 2024 VIX spike is a textbook example of how market structure itself can amplify volatility. The VIX spike to 65 was partly driven by illiquid options contracts in pre-market hours, which fed into the VIX calculation before filtering mechanisms kicked in. Modern algorithmic trading can both dampen and exacerbate these moves depending on how systems are programmed to respond.
Understanding which trigger is active helps you respond appropriately. Use a volatility event checklist before major data releases to prepare your positions. Staying current with market data trends also helps you anticipate which events are likely to move markets in the current environment.
How volatility impacts trading and investing decisions
With volatility’s causes explored, let’s dive into how it shapes the daily choices of traders and investors.
Traders and long-term investors respond to volatility in fundamentally different ways, and that difference is not just about time horizon. It reflects entirely different relationships with price movement.
| Approach | Trader (tactical) | Investor (strategic) |
|---|---|---|
| Time horizon | Minutes to weeks | Months to years |
| Volatility response | Seek or exploit price swings | Tolerate or rebalance through swings |
| Key tool | Real-time alerts, technical analysis | Asset allocation, dollar-cost averaging |
| Main risk | Overtrading during high volatility | Panic selling during drawdowns |
For traders, volatility creates the price movement needed to generate returns. A flat market with no volatility offers no opportunity. But high volatility without discipline leads to overtrading and emotional decisions. The key is having a system. As FINRA notes, volatility is directionless, which means your strategy needs to define the direction, not the market’s mood.

For investors, the danger is behavioral. Seeing a portfolio drop 15% in a week triggers fear responses that can override rational long-term thinking. Volatility does not equal permanent loss, but it can feel that way in the moment.
Real-time data is the great equalizer here. When you have access to live price feeds and pre-set alerts, you replace reactive panic with informed, rule-based action. A real-time alerts guide can show you how to build a monitoring system that keeps you in control without requiring you to watch screens all day.
Pro Tip: Before any high-volatility event, write down your plan. Define your entry, exit, and stop-loss levels in advance. Consult a guide to market fluctuations to understand typical price behavior around earnings or macro releases. Decisions made before the volatility hits are almost always better than ones made during it.
A fresh perspective on market volatility
All these considerations lead to an important mindset shift about volatility in the markets.
Most financial content treats volatility as a problem to be managed or survived. We’d argue that framing is limiting. Volatility is not a malfunction. It is how markets process new information and discover fair prices. Without it, assets would be permanently mispriced and opportunities would disappear.
The traders who consistently perform well are not the ones who predict volatility. They are the ones who have a clear process for responding to it. They use fluctuation analysis strategies to understand what’s happening, not to forecast what comes next.
Here’s the uncomfortable truth: most losses during volatile periods come not from the volatility itself, but from the emotional decisions it triggers. Selling at the bottom, chasing a breakout, doubling down on a losing position. These are behavioral failures, not market failures.
Disciplined traders treat volatility as a signal, not a verdict. They ask: “What is this price movement telling me about supply, demand, and sentiment?” That question leads to better decisions than “Should I be scared right now?” Volatility is the market’s heartbeat. Learning to read it, rather than fear it, is one of the most valuable skills you can develop.
Empower your trading with real-time market data from Handy.Markets
Having redefined how to view volatility, here’s how to put your knowledge to immediate use with the right trading tools.
Real-time data is not a luxury for active traders. It’s the foundation of every informed decision during volatile conditions. When prices are moving fast, delayed data is the same as no data.
At Handy.Markets, we bring together live prices, percentage changes, and volatility signals across stocks, crypto, forex, commodities, and indices in one clean dashboard. You can track live market prices across all asset classes, set free price alerts via Telegram, Discord, Slack, SMS, Webhook, or Email, and monitor live stock quotes without switching between platforms. Stop reacting to volatility after the fact. Start responding to it in real time.
FAQ
Is high volatility always a bad sign for markets?
No. High volatility signals large price swings in either direction, not necessarily losses or a market crisis. Many of the strongest bull market rallies occur during periods of elevated volatility.
What tools can help me track market volatility in real time?
You can use the VIX index, real-time price alert platforms, and multi-asset dashboards to monitor volatility as it develops. Keep in mind that even the VIX can produce extreme outlier readings during illiquid pre-market conditions, so always cross-reference with other data.
Can sudden news events cause extreme volatility?
Yes. Rare, high-impact events known as black swans can send volatility indexes sharply higher within minutes. The August 2024 VIX spike to 65 is a recent example of how fast and extreme these moves can be.
Does volatility affect all asset classes the same way?
No. Stocks, cryptocurrencies, and forex pairs each have distinct volatility profiles driven by different factors, liquidity levels, and market participants. Crypto, for example, routinely sees daily swings that would be considered extreme in equity markets.
Recommended
- Market Volatility Checklist: Strategies For Traders | Handy.Markets
- Mastering Volatility In Investing: A Beginner’s Guide To Navigating Market Swings In 2025 | Handy.Markets
- Understanding Market Fluctuations: A Guide For Traders | Handy.Markets
- Forex Volatility Explained: Key Drivers, Risks & Insights | Handy.Markets