Picking the right stock market indicators feels like choosing from a menu with 500 items and no descriptions. Most investors cycle through dozens of tools, get conflicting signals, and end up more confused than when they started. The good news: stock market indicators fall into four clear categories — technical, economic, market breadth, and sentiment — and once you understand each category’s purpose, the selection process becomes far more logical. This guide breaks down every major indicator type, explains how each one works, and shows you how to combine them into a decision-making framework that actually holds up.
Table of Contents
- Understanding stock market indicator categories
- Technical indicators: Core tools for trend and momentum
- Economic indicators: Interpreting leading, coincident, and lagging signals
- Market breadth indicators: Gauging participation and strength
- Sentiment indicators: Measuring market mood and psychology
- How to combine stock market indicators for decision-making
- Optimize your trading with live market alerts and insights
- Frequently asked questions
Key Takeaways
| Point | Details |
|---|---|
| Categorize before selecting | Understanding indicator categories (technical, economic, breadth, sentiment) helps you choose the right tools for your goals. |
| No single indicator suffices | Combining 2-4 complementary indicators such as trend, momentum, and sentiment leads to more reliable trading signals. |
| Breadth and sentiment matter | Market breadth and sentiment indicators reveal market strength and mood that price action alone may miss. |
| Economic signals predict trends | Tracking leading and coincident economic indicators can help anticipate major market shifts before they happen. |
| Leverage live market alerts | Using real-time alerts enables fast response to indicator signals during volatile or fast-moving markets. |
Understanding stock market indicator categories
Every indicator you’ll encounter belongs to one of four families. Knowing which family an indicator belongs to tells you what question it’s designed to answer — and what it can’t tell you.
Stock market indicators split into four types: technical, economic, market breadth, and sentiment. Each serves a distinct role:
- Technical indicators analyze price and volume data to identify trends, momentum shifts, and volatility patterns on a chart.
- Economic indicators measure the health of the broader economy, helping you understand the macro environment driving stock prices.
- Market breadth indicators reveal how many stocks are participating in a move, confirming whether a rally or selloff is broad or narrow.
- Sentiment indicators capture the emotional state of the market, flagging when fear or greed has pushed prices to extremes.
Using only one category leaves massive blind spots. A stock can look technically perfect while the economy is deteriorating. A market can appear economically healthy while breadth is quietly collapsing. Accessing real-time market data across all four categories is what separates reactive traders from proactive ones.

Technical indicators: Core tools for trend and momentum
Technical indicators are the most widely used tools in active trading. They work directly on price and volume data, making them fast and responsive to market changes.
Here are the major technical indicators every trader should know:
- Moving Averages (SMA, EMA): Average price over a set period to filter out short-term noise and reveal the underlying trend direction.
- RSI (Relative Strength Index): Measures momentum on a 0 to 100 scale. Readings above 70 signal overbought conditions; below 30 signals oversold.
- MACD (Moving Average Convergence Divergence): Tracks the relationship between two EMAs. Crossovers signal momentum shifts.
- Bollinger Bands: Plot two standard deviations around a moving average. Price touching the outer bands flags potential reversals or breakouts.
- ADX (Average Directional Index): Measures trend strength. A reading above 25 confirms a strong trend is in place.
- OBV (On-Balance Volume): Adds volume on up days and subtracts on down days. Rising OBV confirms buying pressure behind a price move.
- ATR (Average True Range): Measures the average price range over a period, giving you a concrete gauge of current volatility magnitude.
| Indicator | Primary use | Key signal level |
|---|---|---|
| RSI | Momentum | >70 overbought, <30 oversold |
| MACD | Trend/momentum | Crossover above/below signal line |
| ADX | Trend strength | >25 strong trend |
| Bollinger Bands | Volatility | Price at upper/lower band |
| ATR | Volatility size | Rising ATR = expanding volatility |
| OBV | Volume confirmation | Divergence from price = warning |
Pro Tip: Don’t use RSI and Stochastic together — they measure nearly the same thing. Pair RSI with MACD instead to get both a momentum reading and a trend confirmation from a single combination.
For traders managing positions during high-volatility periods, pairing ATR with market volatility strategies helps you size positions appropriately rather than guessing. If you’re building a longer-term framework, reviewing investment strategies for 2026 alongside technical signals adds important context. And if your current charting platform feels limiting, exploring charting tool alternatives can open up better visualization options.
Economic indicators: Interpreting leading, coincident, and lagging signals
Technical signals are crucial, but economic fundamentals are just as telling. Economic indicators are grouped by timing: they either predict what’s coming, reflect what’s happening now, or confirm what already occurred.
Here’s how the three types break down:
- Leading indicators move before the economy changes direction. Examples include yield curve inversions, building permits, and the LEI (Leading Economic Index), which contains 10 components including S&P 500 returns and consumer confidence.
- Coincident indicators move in sync with the economy. GDP growth rate and industrial production tell you what’s happening right now.
- Lagging indicators confirm trends after they’ve formed. Rising unemployment and CPI changes typically appear after a downturn is already underway.
The PMI (Purchasing Managers’ Index) deserves special attention. A PMI reading above 50 marks economic expansion; below 50 signals contraction. It’s one of the fastest-releasing economic data points available, often moving live stock quotes significantly on release day.
“The yield curve has inverted before every U.S. recession since 1955, with only one false positive in that span.” This makes it one of the most watched leading indicators among institutional investors.
Pro Tip: Don’t trade the lagging indicators — use them to confirm your thesis after the fact. Trade the leading indicators, and use coincident data to validate that the trend is still intact.
Tracking how these releases affect prices in real time is essential. Staying current with market data trends helps you anticipate how markets typically react to each data type before the numbers drop.
Market breadth indicators: Gauging participation and strength
A rising index doesn’t always mean a healthy market. Breadth indicators reveal whether the move is driven by a handful of mega-cap stocks or by broad participation across the market.
Key market breadth indicators include:
- Advance-Decline Line (A/D Line): Tracks the cumulative difference between advancing and declining stocks. A rising A/D Line alongside rising prices confirms a healthy uptrend.
- McClellan Oscillator: A short-term breadth oscillator. Readings above 100 signal overbought conditions; below -100 signals oversold.
- TRIN (Arms Index): Compares the ratio of advancing to declining stocks against the ratio of advancing to declining volume. Below 1 is bullish; above 1 is bearish. Extreme readings below 0.75 or above 1.25 are strong signals.
- New Highs/New Lows: Tracks how many stocks are making 52-week highs versus lows. Expanding new highs confirm bullish momentum.
- Percent of stocks above moving average: When fewer than 20% of S&P 500 stocks trade above their 200-day MA, the market is deeply oversold.
- Zweig Breadth Thrust: When the 10-day ratio of advancing issues jumps above 40%, it historically signals the start of a new bull market.
| Indicator | Bullish signal | Bearish signal |
|---|---|---|
| A/D Line | Rising with price | Falling while price rises (divergence) |
| McClellan Oscillator | Below -100 (reversal) | Above +100 (reversal) |
| TRIN | Below 0.75 | Above 1.25 |
| % above 200-day MA | >60% | <20% |
Divergences are the most powerful breadth signals. When the S&P 500 makes a new high but the A/D Line fails to confirm, that’s a warning that the rally is narrowing. Pairing breadth analysis with a volatility checklist gives you a fuller picture of whether a move has staying power.
Sentiment indicators: Measuring market mood and psychology
Finally, let’s explore how market psychology influences trading decisions. Sentiment indicators measure the emotional temperature of the market. They’re most powerful at extremes, where fear or greed has pushed prices beyond what fundamentals justify.
Core sentiment indicators include:
- VIX (CBOE Volatility Index): Often called the “fear gauge.” A VIX above 30 signals elevated fear and potential market bottoms. A VIX below 15 signals complacency.
- AAII Sentiment Survey: Weekly survey of retail investors. When bullish sentiment drops well below its historical average of around 38%, contrarian buyers pay attention.
- Fear & Greed Index: A composite of seven market factors. Readings below 25 signal extreme fear and historically mark buy opportunities.
- Put/Call Ratio: Measures options market positioning. A high ratio (more puts than calls) signals bearish sentiment; contrarian traders use spikes as buy signals.
Key stat: When the Fear & Greed Index drops below 25, the S&P 500 has historically produced above-average returns over the following 12 months. Extreme fear is often a better buy signal than any technical setup.
Retail and institutional investors use sentiment differently. Institutions often fade extreme retail sentiment, positioning opposite to the crowd. Retail investors, by contrast, tend to pile in at peaks and panic at bottoms. Understanding which camp you’re in helps you use these tools more honestly. Exploring investment articles on behavioral finance can sharpen this self-awareness considerably.
Pro Tip: Never use sentiment as a standalone entry trigger. Use it to identify when the market is at a potential turning point, then wait for a technical confirmation before acting.
How to combine stock market indicators for decision-making
Now that you know the main indicators, here’s how to use them together for enhanced trading decisions. The biggest mistake investors make is stacking too many indicators from the same category. Five momentum indicators don’t give you five times the signal — they give you the same signal five times.
Here’s a practical framework for combining indicators:
- Start with trend: Use a moving average or ADX to establish whether the market is trending or ranging. This determines which other tools are relevant.
- Add momentum: Apply RSI or MACD to gauge the strength and direction of the move within that trend.
- Confirm with volume: Check OBV or raw volume to verify that price moves have genuine participation behind them.
- Filter with sentiment: Use VIX or the Fear & Greed Index to assess whether the market is at an emotional extreme that might override technical signals.
No single indicator is sufficient — using 2 to 4 complementary types gives you the most reliable signals without creating noise.
“Confluence is everything. When trend, momentum, volume, and sentiment all point the same direction, the probability of a successful trade rises dramatically.”
Institutional traders add VWAP (Volume Weighted Average Price) and order flow analysis to this mix, tools that reveal where large players are positioned. Retail traders rarely have access to order flow data, which is why breadth and sentiment indicators are especially valuable for leveling the playing field.
Pro Tip: Keep a simple checklist. Before any trade, ask: What does trend say? What does momentum say? Does volume confirm? Is sentiment at an extreme? If three of four align, you have a high-probability setup.
Building this discipline around maximize returns strategies and keeping a live eye on track financial markets data ensures your framework stays grounded in real conditions, not just theory.
Optimize your trading with live market alerts and insights
Understanding indicator categories is only half the equation. Acting on them in real time is where the edge actually lives. That’s where Handy.Markets comes in.
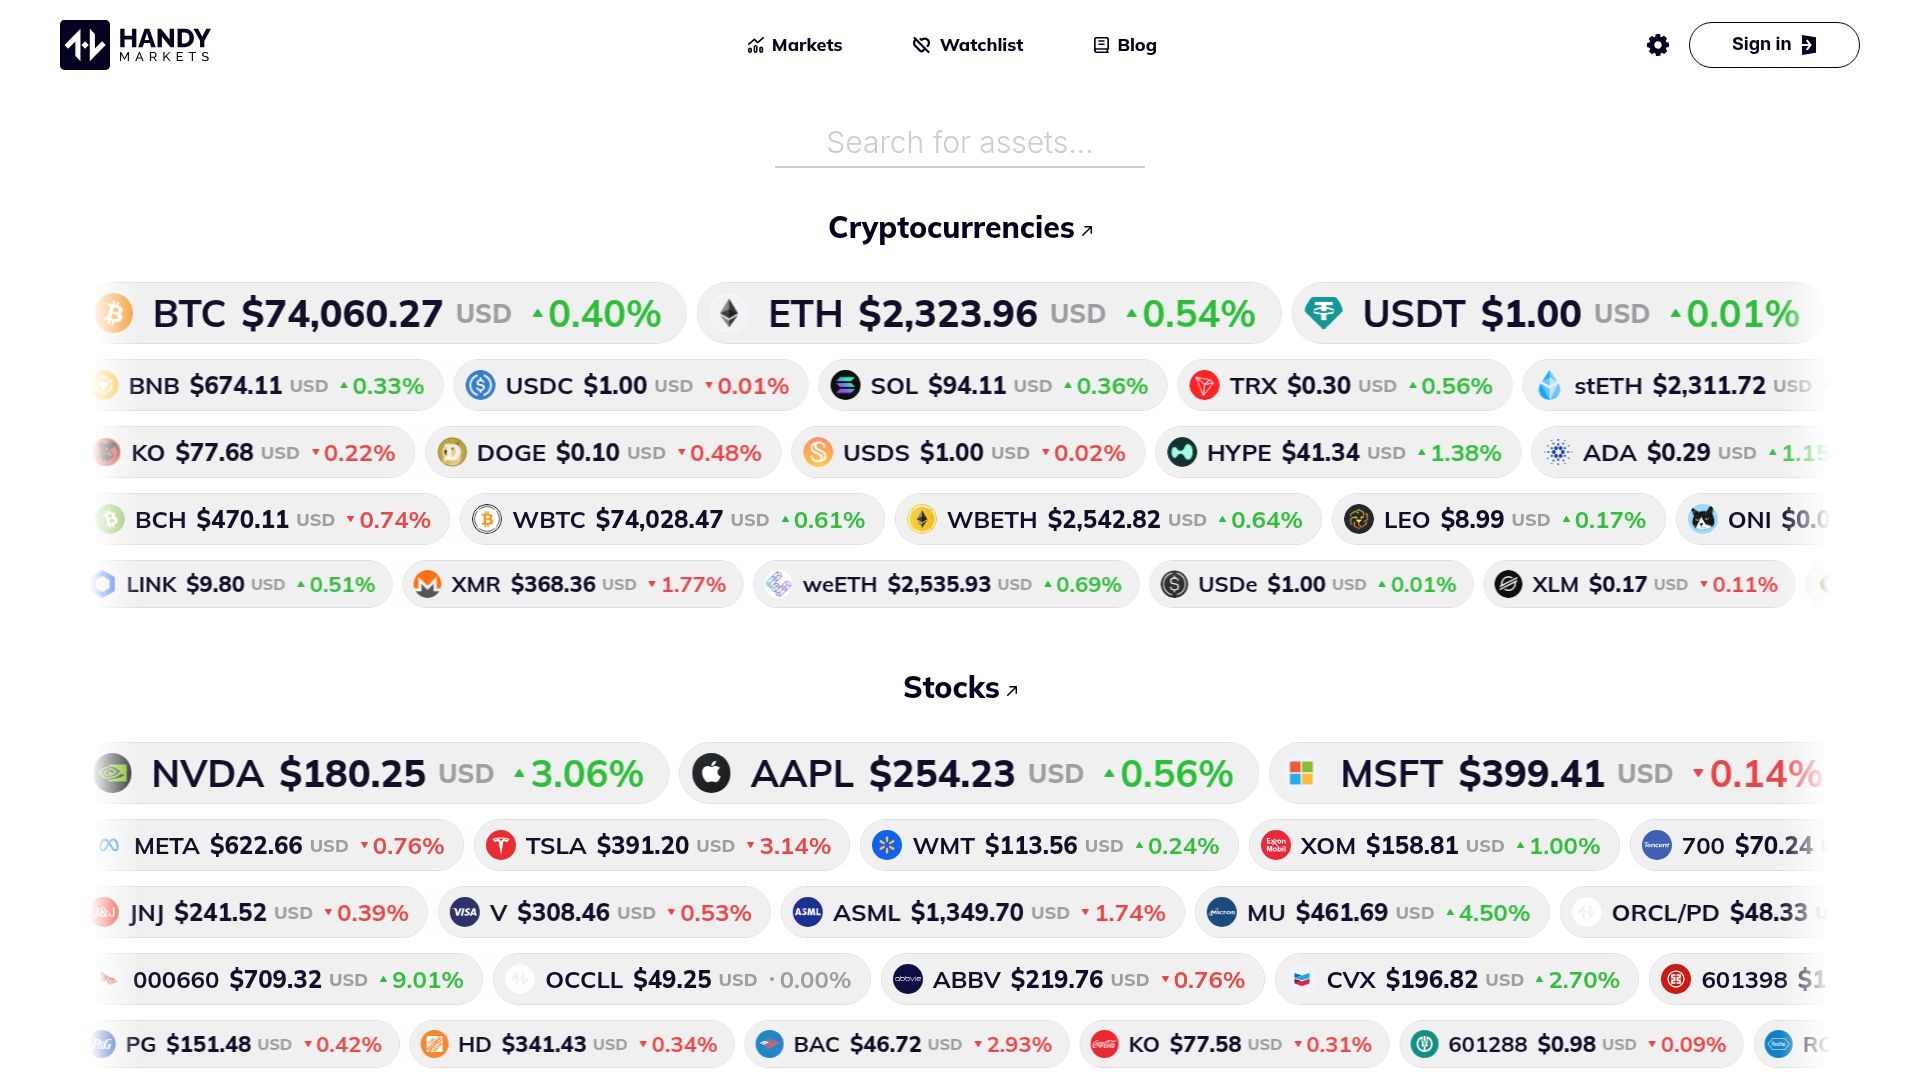
Handy.Markets aggregates live prices, percentage changes, and market data across stocks, crypto, commodities, indices, and forex — all in one place. You can monitor technical setups, track economic release impacts, and watch breadth shifts without jumping between platforms. The price alert features let you set custom notifications via Telegram, Discord, Slack, SMS, Webhook, or Email, so you catch critical signals the moment they trigger. Whether you’re watching a VIX spike, an RSI crossover, or a breakout in live stock alerts, Handy.Markets keeps you informed and ready to act.
FAQ
What are the most reliable stock market indicators?
No single indicator is reliable for all market conditions. Combining 2 to 4 complementary types — trend, momentum, volume, and sentiment — produces the most consistent signals.
How do moving averages filter price noise?
Moving averages smooth price data by calculating the average closing price over a defined period, which removes short-term spikes and reveals the underlying trend direction.
What economic indicators predict recessions?
Yield curve inversions and declining LEI components are the most historically reliable recession predictors, typically signaling downturns 6 to 18 months in advance.
When is the VIX considered high and what does it mean?
A VIX reading above 30 signals elevated fear and heightened volatility expectations. It frequently appears near market bottoms, making it a useful contrarian signal for patient investors.
Can sentiment indicators help spot buy opportunities?
Yes. Extreme fear readings in the Fear & Greed Index (below 25) or unusually low bullish readings in the AAII survey have historically preceded strong market recoveries.
Recommended
- Market Volatility Checklist: Strategies For Traders | Handy.Markets
- Market Monitoring Guide: Real-Time Alerts For Traders | Handy.Markets
- Top 5 Marketcharts.com Alternatives 2026 | Handy.Markets
- Understanding Market Fluctuations: A Guide For Traders | Handy.Markets
- Trading gold vs. other metals: insights for investors