TL;DR:
- Many successful investors focus on indices to understand overall market trends and sentiment.
- Different index types reveal various market insights, such as large-cap dominance or sector shifts.
- Tracking indices helps optimize timing, risk management, and benchmarking strategies effectively.
Most retail investors spend their time hunting for the next breakout stock, scrolling through earnings reports and analyst upgrades. Yet some of the most consistent investors in the market barely glance at individual tickers. Instead, they watch indices. Stock indices are the pulse of the market, and learning to read them gives you a shortcut to understanding where the whole financial landscape is heading. This guide breaks down what indices actually measure, how different types work, and how tracking them can sharpen your trading decisions in ways that picking individual stocks simply cannot.
Table of Contents
- What stock indices actually measure and why it matters
- Types of indices and what each reveals about the market
- How tracking indices can boost your trading and investing decisions
- Hidden risks, common pitfalls, and the nuances of index tracking
- A smarter way to use indices and what most investors miss
- Take your market tracking to the next level
- Frequently asked questions
Key Takeaways
| Point | Details |
|---|---|
| Indices reveal market health | Tracking stock indices helps you quickly understand market trends and overall direction. |
| Benchmark your performance | Indices let you compare your portfolio against the market easily. |
| Index mechanics matter | How an index is built affects what its movement really means. |
| Smart tracking prevents mistakes | Knowing index quirks helps you avoid common investing pitfalls. |
What stock indices actually measure and why it matters
A stock index is not just a number on a screen. It is a carefully constructed snapshot of a group of stocks, designed to represent a slice of the market. The S&P 500 tracks 500 of the largest U.S. companies. The Dow Jones Industrial Average (DJIA) follows 30 blue-chip giants. The Nasdaq Composite leans heavily into technology. Each one tells a different story about what the market is doing at any given moment.
Think of an index like a weather report for investing. Just as you would not step outside without checking whether it is raining, you should not make a trade without knowing the broader market climate. Stock indices serve as benchmarks for evaluating portfolio performance, proxies for market trends and volatility, and bases for passive investing. That triple role is what makes them so powerful.
For retail investors, indices offer something individual stocks cannot: context. If your portfolio dropped 5% last month, that feels bad. But if the S&P 500 dropped 8% in the same period, your portfolio actually outperformed. Without the index as a reference point, you are flying blind.
Here is what indices help you assess at a glance:
- Market direction: Is the overall market trending up, down, or sideways?
- Sector health: Are technology stocks leading or lagging the broader market?
- Investor sentiment: Are markets calm or in a state of fear?
- Portfolio performance: How does your strategy compare to a passive benchmark?
“An index is not just a scoreboard. It is a map of where money is flowing, where risk is concentrated, and where opportunities may be forming.”
If you are newer to this concept, stock indices explained in detail can help you build that foundational understanding before applying it to real trades.
Types of indices and what each reveals about the market
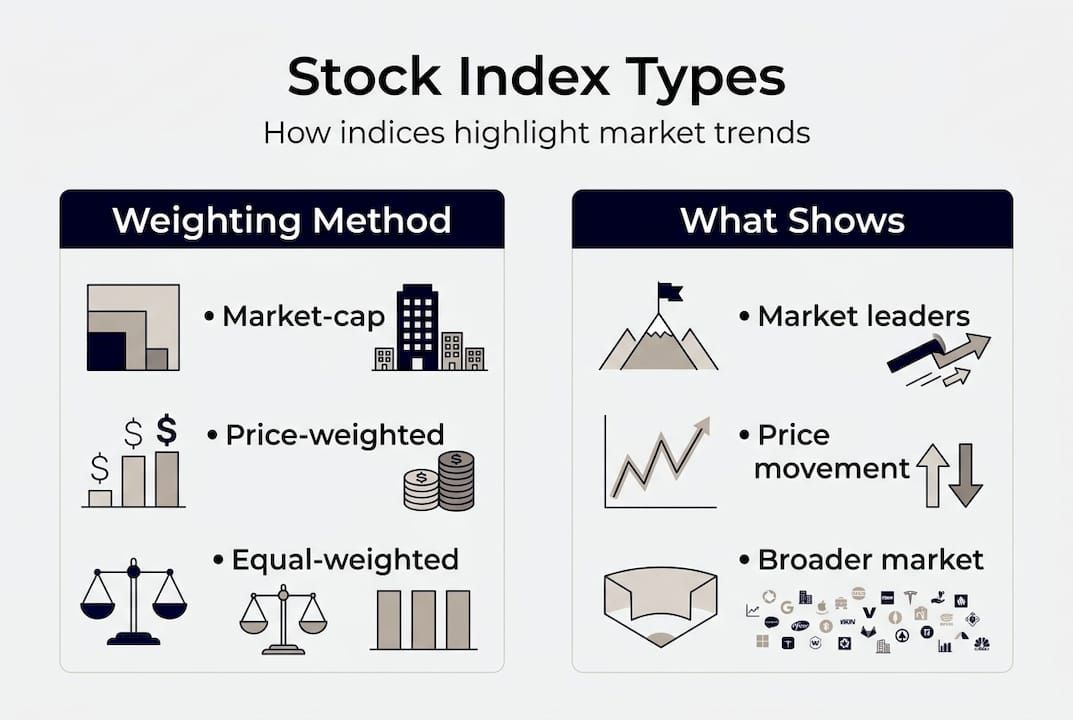
Not all indices are built the same way, and that difference in construction is what makes each one tell a slightly different story. Understanding the mechanics behind an index helps you interpret its movements correctly.
Indices use weighting methods like market-cap, price-weighted, and equal-weighted structures, and each has its own effects and quirks that shape the signals you receive.
| Index type | How it works | Key example | What it highlights |
|---|---|---|---|
| Market-cap weighted | Larger companies have more influence | S&P 500 | Dominant large-cap trends |
| Price-weighted | Higher-priced stocks carry more weight | DJIA | Legacy blue-chip movements |
| Equal-weighted | Every stock counts the same | Equal-weight S&P 500 | Broad market breadth |
The S&P 500, being market-cap weighted, means Apple, Microsoft, and Nvidia can move the entire index significantly. That is useful when you want to track where institutional money is flowing. But it can also mask weakness in smaller companies.

The DJIA, being price-weighted, means a stock trading at $400 influences the index more than one trading at $40, regardless of the company’s actual size. This creates a quirk: stock splits can artificially change a company’s influence without any real change in business value.
Equal-weighted indices are less common but arguably more democratic. They give you a truer sense of how the average stock is performing, not just the giants at the top.
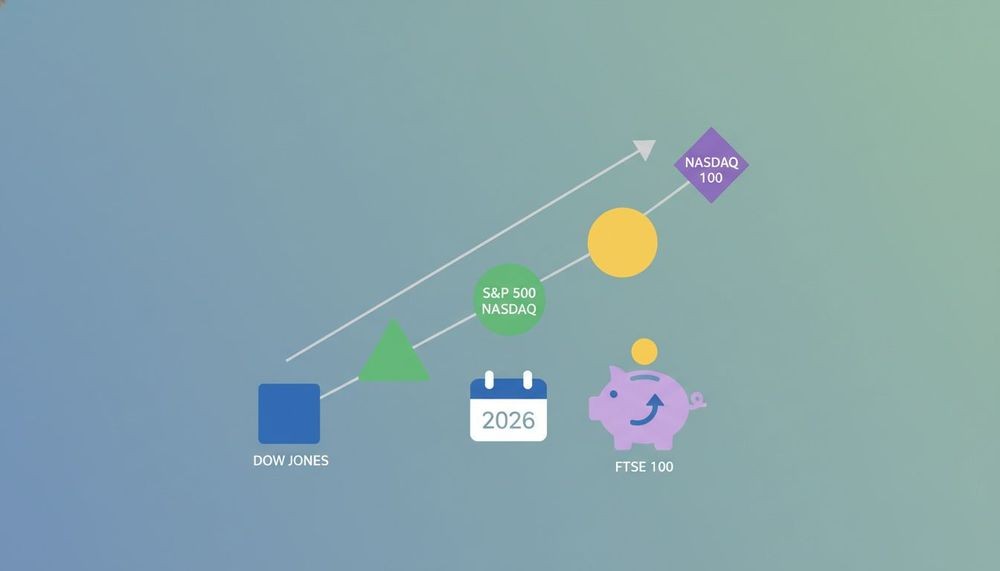
Key indices to watch and why:
- S&P 500: The gold standard for U.S. equity benchmarking
- Nasdaq Composite: Best for tracking tech and growth stocks
- DJIA: A historical reference, useful for blue-chip sentiment
- Russell 2000: Tracks small-cap stocks, a leading indicator for economic momentum
- VIX: The volatility index, often called the market’s “fear gauge”
Pro Tip: When the S&P 500 and its equal-weighted version diverge significantly, it often signals that only a handful of mega-cap stocks are driving gains. That is a warning sign worth paying attention to.
For a deeper look at how these benchmarks interact with your strategy, market indices benchmarks offers practical context on applying them effectively.
How tracking indices can boost your trading and investing decisions
Once you understand the mechanics, the real value of indices comes from applying them to your actual decisions. Tracking indices is not a passive exercise. It is an active tool for timing, sentiment reading, and strategy refinement.
Retail investors and traders track indices for market sentiment, trend and volatility assessment, informed entries and exits, and benchmarking their trades. Here is how that plays out in practice:
- Read market sentiment quickly: A rising S&P 500 with low VIX signals a calm, bullish environment. A falling index with a spiking VIX signals fear and potential selling pressure. You can gauge this in seconds.
- Time your entries and exits: Many traders avoid opening new positions when the broader index is in a confirmed downtrend. Waiting for index confirmation reduces the risk of fighting the tape.
- Benchmark your strategy: If your active stock picks consistently underperform the S&P 500 over 12 months, that is valuable data. It might mean a passive index fund serves you better.
- Spot sector rotation: When the Nasdaq lags while the Russell 2000 surges, money is rotating from growth to smaller cyclical stocks. That shift can inform where you look for opportunities next.
- Manage volatility exposure: Checking our volatility checklist alongside index readings helps you decide when to reduce position sizes or add hedges.
For traders who want to go further, market fluctuation analysis walks through the methods and tools used to interpret those movements with precision.
Stat to remember: Passive index funds that track the S&P 500 have outperformed roughly 80% to 90% of actively managed large-cap funds over 15-year periods, according to SPIVA data. That alone tells you how powerful index-level thinking can be.
Hidden risks, common pitfalls, and the nuances of index tracking
Tracking indices is powerful, but it is not foolproof. There are real risks in misreading what an index is telling you, and some of those mistakes are surprisingly common even among experienced investors.
Cap-weighted indices can become highly concentrated, price-weighted indices are distorted by stock splits, and tracking error and total return distinctions matter more than most investors realize.
| Common pitfall | What goes wrong | How to avoid it |
|---|---|---|
| Overreliance on cap-weighted indices | A few mega-caps mask broader weakness | Compare with equal-weight version |
| Ignoring total return vs. price return | Dividends excluded from price return | Always check total return data |
| Treating all indices as equivalent | Different structures send different signals | Know what each index measures |
| Ignoring tracking error | Your ETF may not perfectly mirror the index | Check the fund’s tracking error regularly |
One of the most overlooked distinctions is total return vs. price return. The S&P 500 price return index only tracks price changes. The total return version reinvests dividends, and over the long run, that difference adds up to roughly 9% in performance. If you are comparing your portfolio to the wrong version, your benchmarking is off from the start.
Another trap is assuming that because the S&P 500 is up, everything is fine. In 2023, the index’s gains were heavily concentrated in just seven mega-cap tech stocks. The average stock in the index barely moved. That kind of hidden concentration risk can lull you into a false sense of security.
“A rising index does not mean a rising market. Sometimes it just means a few very large companies had a good quarter.”
Here are the most important nuances to keep in mind:
- Concentration risk: The top 10 stocks in the S&P 500 can represent over 30% of the index’s total weight
- Dividend blindness: Price-only indices understate real returns significantly over time
- Sector skew: Tech-heavy indices like the Nasdaq may not reflect broader economic conditions
- Rebalancing effects: Index composition changes over time, and those changes affect what you are actually tracking
For a broader view of how volatility interacts with these risks, our market volatility guide and market trends strategy offer practical frameworks for navigating these nuances.
A smarter way to use indices and what most investors miss
Here is something most guides will not tell you: indices are not just a performance scoreboard. They are a decision filter. The most effective traders we have observed do not just use indices to see how the market is doing. They use them to decide whether to trade at all.
When the VIX spikes above 30 and the S&P 500 breaks below its 200-day moving average, that is not just a bearish signal. It is a regime shift. The rules of the game change. Strategies that work in calm, trending markets often fail in high-volatility, directionless ones.
Most retail investors ignore this context entirely. They keep trading the same way regardless of what the broader market is signaling. That is where index tracking becomes a genuine edge, not just a background metric.
Combining index signals with market monitoring alerts, sector rotation data, and macro news creates a layered view that most individual stock analysis simply cannot provide. The index is the frame. Everything else fits inside it.
Take your market tracking to the next level
You now have a solid foundation for reading indices, understanding their structure, and applying their signals to real decisions. The next step is making sure you never miss a critical market movement.
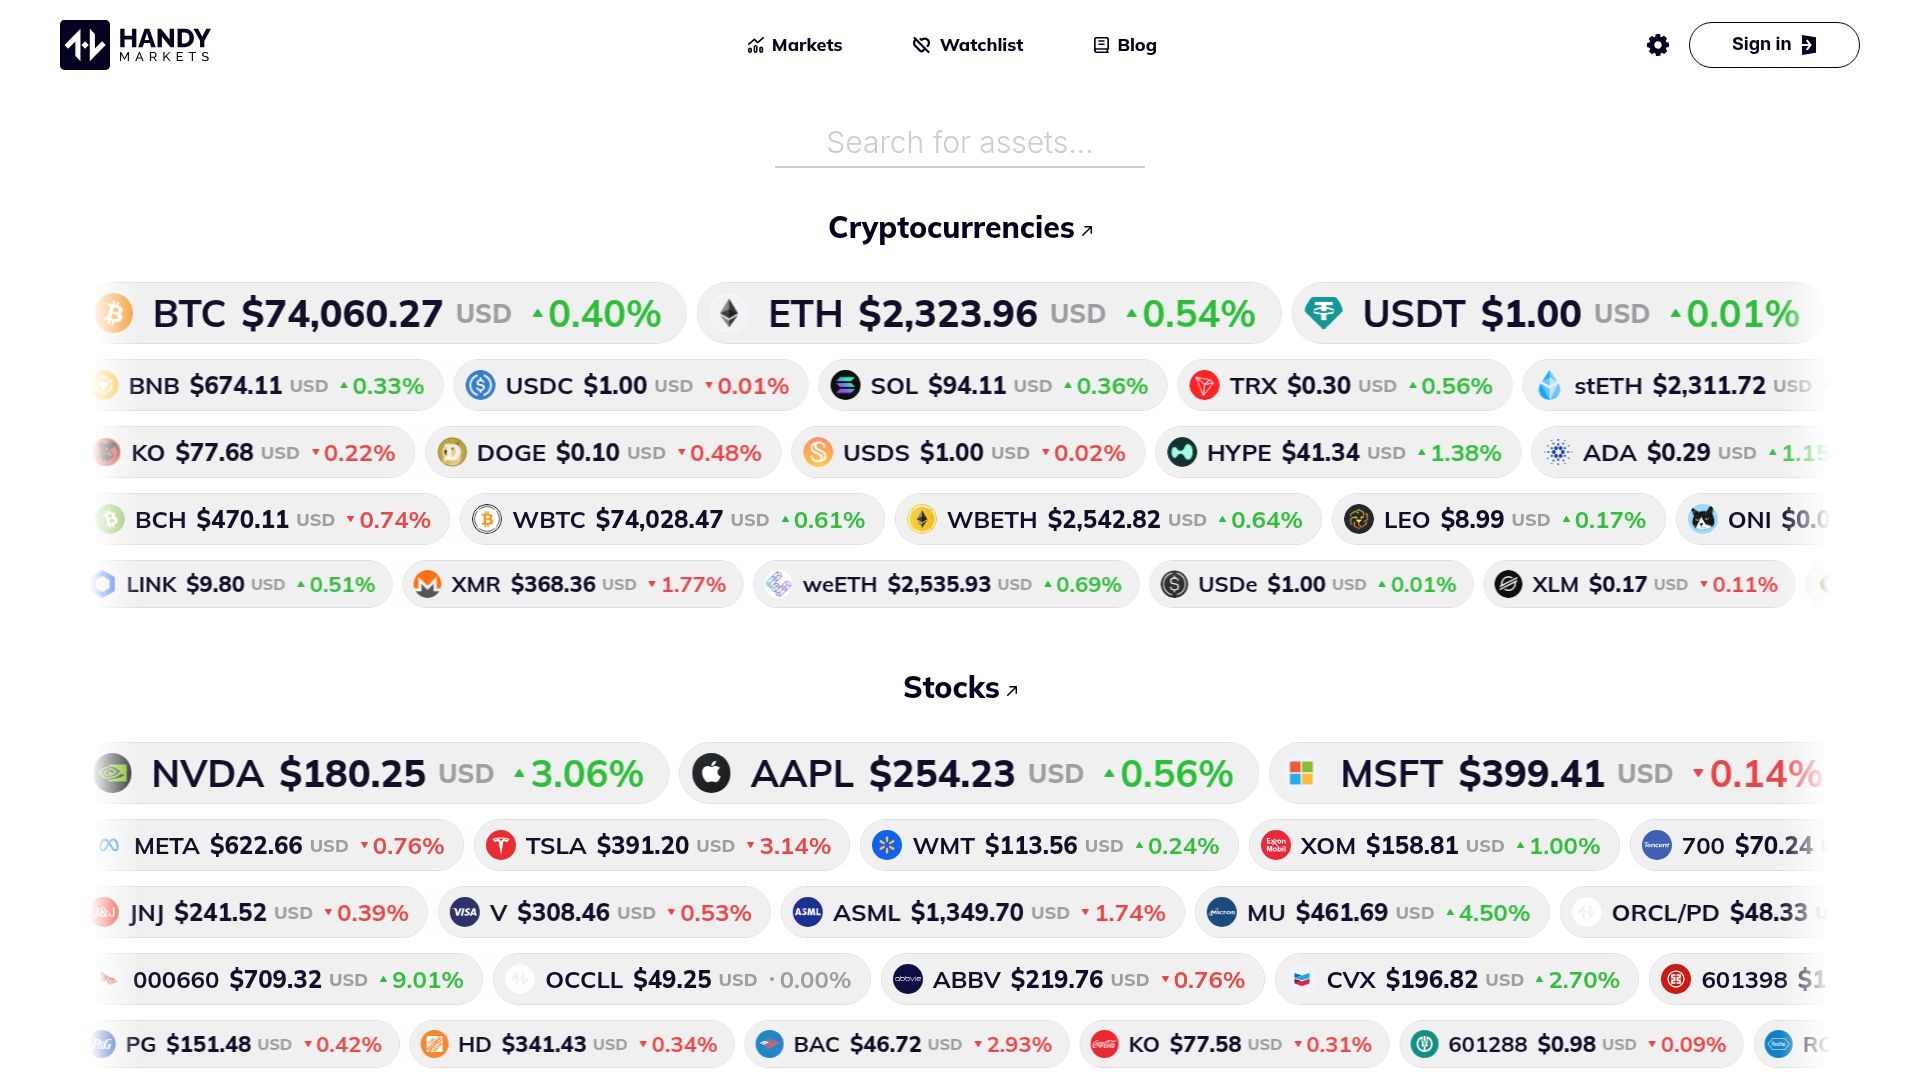
At Handy.Markets, you can track markets across indices, stocks, crypto, commodities, and forex in one clean dashboard. Set up instant price alerts delivered straight to your Telegram, Discord, Slack, SMS, or email so you are always in the loop when key levels are hit. You can even monitor crypto price alerts alongside your index watchlist for a truly complete market picture. Staying informed has never been this straightforward.
FAQ
Why should retail investors track stock indices instead of individual stocks?
Tracking indices gives you a snapshot of the overall market and helps benchmark your performance without analyzing every stock. Indices serve as benchmarks for evaluating portfolio performance and gauging market health, making them an efficient first filter for any investor.
Which index is best for tracking U.S. market trends?
The S&P 500 is generally considered the best benchmark for U.S. market trends because it covers about 80% of the total U.S. equity market capitalization, making it the primary reference point for most investors and fund managers.
What is the difference between price return and total return for an index?
Total return includes reinvested dividends while price return does not, and that gap adds up to roughly 9% in performance difference over the long term. Always confirm which version you are comparing your portfolio against.
Are all indices equally useful for trading?
No, each index type highlights different aspects of the market, so knowing what signal you are tracking matters. Different index structures like cap-weighted, price-weighted, and equal-weighted each convey distinct information about market breadth and momentum.
Recommended
- Stock Indices Explained: Your Essential Guide To Market Benchmarks | Handy.Markets
- Key Stock Market Trends Driving Investment Moves In 2026 | Handy.Markets
- Top Investment Strategies To Maximize Returns In 2026 | Handy.Markets
- Financial Markets: Track Crypto, Stocks, Forex, Indices, Commodities & ETFs Prices With Alerts | Handy.Markets