
Many traders believe market fluctuations are random, unpredictable chaos beyond their control. This misconception costs investors opportunities and exposes them to unnecessary risks. In reality, market fluctuations stem from economic indicators, investor sentiment, and technical events that follow identifiable patterns across asset classes. This guide explores the fundamental drivers behind price movements in stocks, cryptocurrencies, commodities, and forex markets. You’ll discover practical tools for interpreting volatility, strategies for managing risk during turbulent periods, and how to transform market swings from threats into strategic advantages. Understanding these dynamics empowers smarter trade timing and stronger portfolio performance.
Table of Contents
- What Causes Market Fluctuations? Key Factors Explained
- How Different Asset Classes Fluctuate: Stocks Vs. Cryptocurrencies And More
- Tools And Indicators For Interpreting Market Fluctuations
- Practical Strategies For Managing Market Fluctuations In Your Trading
- Explore Handy.markets For Live Market Insights And Alerts
- Frequently Asked Questions
Key takeaways
| Point | Details |
|---|---|
| Multiple factors drive fluctuations | Economic data, investor psychology, and technical events combine to create price movements across all markets. |
| Asset classes behave differently | Cryptocurrencies show sharper swings than stocks, while commodities respond to supply dynamics and geopolitical shifts. |
| Analytical tools reveal patterns | Technical indicators, volume data, and alert systems help traders interpret and anticipate market movements effectively. |
| Risk management protects capital | Diversification, position sizing, and disciplined exits reduce exposure during volatile periods. |
| Real-time monitoring matters | Live data and instant notifications enable traders to respond quickly to changing market conditions. |
What causes market fluctuations? Key factors explained
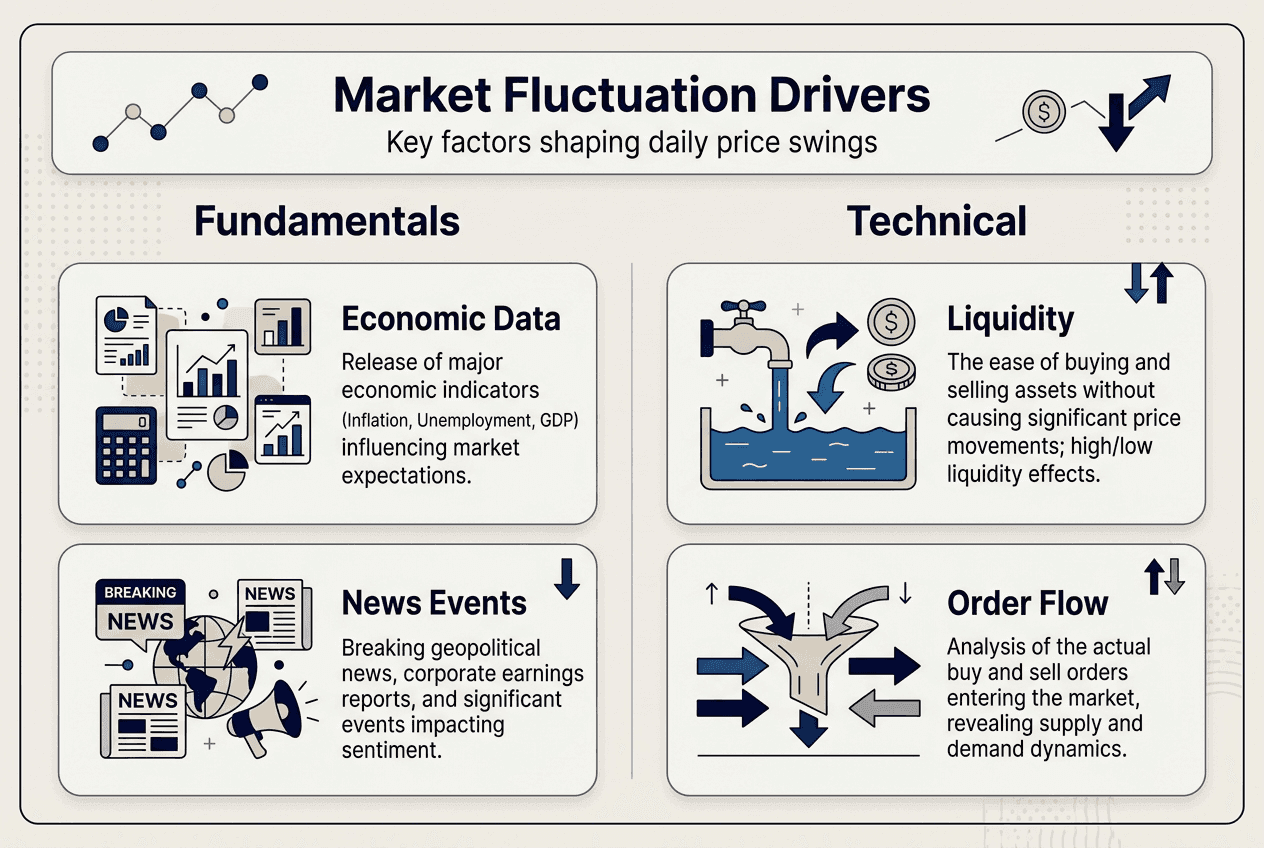
Market fluctuations don’t happen in a vacuum. Three primary categories of factors drive price movements: economic fundamentals, psychological dynamics, and technical catalysts. Understanding how these forces interact helps you anticipate volatility rather than react blindly.
Economic data releases create immediate market responses. Inflation reports, employment figures, GDP announcements, and central bank decisions directly impact investor expectations about future asset values. When the Federal Reserve signals interest rate changes, for example, equity and bond markets adjust within minutes. Corporate earnings reports trigger stock-specific volatility as traders reassess company valuations based on actual performance versus projections.
Investor psychology amplifies these fundamental movements. Fear and greed cycles create buying and selling waves that push prices beyond rational levels. During market panics, traders dump assets regardless of underlying value, creating oversold conditions. Conversely, euphoric periods drive prices to unsustainable heights as FOMO (fear of missing out) dominates decision making. These sentiment shifts explain why markets often overreact to news before settling at more reasonable levels.
Technical factors add another layer of complexity. Liquidity conditions determine how easily large orders move prices. Thin markets with low trading volume experience sharper swings than deep, liquid markets. News events, especially unexpected geopolitical developments or regulatory announcements, create sudden volatility spikes. Cryptocurrencies generally have higher volatility compared to stocks and commodities because their markets combine lower liquidity with intense sentiment-driven trading.
Pro Tip: Always verify the economic calendar to anticipate potential volatility. Major releases like non-farm payrolls, CPI data, and FOMC meetings create predictable windows of increased price action. Planning trades around these events helps you avoid unexpected whipsaws or deliberately position for breakout opportunities.
The interaction between these factors creates the complex price patterns you observe daily. A strong jobs report might boost stocks initially, but if it raises inflation concerns, the rally could reverse as traders price in tighter monetary policy. Recognizing these cause-and-effect relationships transforms seemingly chaotic movements into readable market language.
How different asset classes fluctuate: stocks vs. cryptocurrencies and more
Each asset class exhibits unique fluctuation characteristics shaped by its underlying market structure, participant base, and fundamental drivers. Recognizing these differences helps you calibrate risk expectations and strategy choices.
Stock market fluctuations reflect corporate performance, sector trends, and macroeconomic conditions. Individual stocks respond to earnings reports, management changes, product launches, and competitive dynamics. Broader market indices move with economic cycles, interest rate expectations, and investor risk appetite. Blue-chip stocks typically show moderate volatility, while small-cap and growth stocks swing more dramatically. Market hours concentrate trading activity, creating distinct intraday patterns compared to 24/7 markets.
Cryptocurrency price volatility operates at a different magnitude entirely. Digital assets experience price swings of 10-20% in single days during normal conditions, with extreme events triggering 30-50% moves. Several factors explain this heightened volatility. Crypto markets never close, allowing sentiment shifts to cascade without circuit breakers. Lower overall market capitalization means individual large trades impact prices more significantly. Regulatory uncertainty creates sudden policy-driven selloffs or rallies. The participant base skews toward speculative traders rather than long-term holders, amplifying momentum in both directions.

Commodity market volatility stems from physical supply and demand dynamics. Weather patterns affect agricultural products. Geopolitical tensions disrupt energy supplies. Industrial demand cycles drive metals prices. Unlike stocks or cryptos, commodities have intrinsic use value that creates fundamental price floors and ceilings. Storage costs, seasonal patterns, and production cycles add predictable elements to their fluctuation patterns. However, sudden supply shocks like oil embargoes or crop failures can trigger extreme price spikes.
Forex markets reflect currency strength driven by international trade flows, interest rate differentials, and central bank policies. Major currency pairs like EUR/USD typically show lower volatility than stocks, with daily ranges of 0.5-1% being normal. However, emerging market currencies can swing wildly during economic crises. Forex volatility concentrates around economic releases and overlapping market hours when multiple financial centers trade simultaneously.
Pro Tip: Adapt your risk management strategies according to asset volatility profiles. A position size appropriate for forex trading might expose you to excessive risk in crypto markets. Calculate position sizes based on dollar risk per trade, not arbitrary percentages of capital, to maintain consistent risk across different asset classes.
Understanding these distinctions prevents the common mistake of applying strategies developed for one asset class to another without adjustment. A momentum strategy that works brilliantly in crypto markets might generate excessive whipsaws in less volatile stock markets.
Tools and indicators for interpreting market fluctuations
Raw price data tells an incomplete story. Analytical tools transform market noise into actionable insights by revealing trends, momentum shifts, and potential reversal points. Mastering a core set of indicators gives you frameworks for interpreting fluctuations systematically.
Moving averages smooth price action to reveal underlying trends. Simple moving averages (SMA) calculate the average price over a specified period, creating a line that filters out short-term noise. Exponential moving averages (EMA) weight recent prices more heavily, making them more responsive to current conditions. Traders watch for crossovers when faster averages cross above or below slower ones, signaling potential trend changes. The 50-day and 200-day moving averages are particularly significant for identifying major support and resistance levels.
Relative Strength Index (RSI) measures momentum by comparing recent gains to recent losses on a 0-100 scale. Readings above 70 suggest overbought conditions where prices may have risen too far too fast, while readings below 30 indicate oversold conditions. However, strong trends can keep RSI in extreme territory for extended periods, so use it alongside trend indicators rather than as a standalone signal.
Moving Average Convergence Divergence (MACD) combines multiple moving averages to identify momentum shifts and trend strength. The indicator plots the difference between two EMAs as a line, with a signal line overlay. When the MACD line crosses above the signal line, it suggests strengthening upward momentum. Divergences between MACD and price action often precede reversals, giving advance warning of potential trend changes.
Technical indicators and alerts provide insights to navigate market swings effectively. Setting alerts for sudden price changes ensures you don’t miss critical movements when away from screens. Price alerts notify you when assets reach specific levels, while percentage change alerts flag unusual volatility. Volume alerts identify when trading activity surges, often preceding major moves.
Volume and order book data confirm trend validity. Rising prices on increasing volume suggest strong conviction behind the move, while price advances on declining volume may indicate weakening momentum. Order book depth shows concentration of buy and sell orders at various price levels, revealing potential support and resistance zones where large orders wait.
Integrating alerts into your trading routine requires systematic setup. First, identify key price levels based on technical analysis: recent highs and lows, moving average levels, and round numbers that often act as psychological barriers. Set alerts slightly before these levels to prepare for potential reactions rather than scrambling after price already moved. Configure alerts across multiple channels so you receive notifications regardless of which device you’re using.
Pro Tip: Combine indicators to reduce false signals and improve accuracy. No single indicator works perfectly in all conditions. Use trend indicators like moving averages to establish market direction, then apply momentum indicators like RSI to time entries within that trend. Volume confirms whether moves have conviction or represent noise.
The goal isn’t to use every available indicator but to master a focused toolkit that provides complementary perspectives on market conditions. This disciplined approach prevents analysis paralysis while ensuring you consider multiple dimensions of price action.
Practical strategies for managing market fluctuations in your trading
Understanding fluctuations intellectually means nothing without practical strategies for managing them in real trading. These tactics help you protect capital during volatile periods while positioning for opportunities that volatility creates.
Diversification reduces exposure to single asset volatility. Spreading capital across multiple assets, sectors, and even asset classes means individual price swings impact your overall portfolio less dramatically. When tech stocks sell off, commodities or defensive sectors might hold steady or rally. Geographic diversification adds another layer, as different markets don’t always move in lockstep. However, diversification works best when assets have low correlation. Holding ten different cryptocurrencies provides less protection than it appears since crypto assets tend to move together.
Setting stop-loss and take-profit levels enforces disciplined exits. Stop-loss orders automatically close positions when prices move against you by a predetermined amount, preventing small losses from becoming catastrophic. Place stops based on technical levels like recent swing lows rather than arbitrary percentages. Take-profit orders lock in gains when prices reach your target, removing emotion from the decision to exit winning trades. Many traders exit portions of positions at multiple profit targets, securing some gains while letting remaining shares ride for larger moves.
Position sizing techniques manage risk with volatility. The fundamental principle: risk a consistent dollar amount per trade regardless of asset volatility. If you risk $100 per trade, a volatile crypto position requires fewer shares than a stable stock position to maintain that same dollar risk. Calculate position size by dividing your risk amount by the distance from entry to stop-loss. This approach prevents volatile assets from dominating your risk profile simply because their percentage moves are larger.
Hedging using options or ETFs provides insurance during unstable periods. Buying put options on holdings or indices gives you the right to sell at predetermined prices, limiting downside while maintaining upside potential. Inverse ETFs gain value when their underlying indices decline, offsetting losses in long positions. These hedges cost money through option premiums or tracking inefficiencies, so use them selectively during periods of elevated uncertainty rather than continuously.
Active risk management and strategy adaptation improve success during fluctuating markets. Market conditions change, requiring corresponding strategy adjustments. Trending markets reward momentum strategies that add to winning positions. Range-bound markets favor mean-reversion approaches that buy oversold levels and sell overbought levels. Volatile, directionless markets might call for reduced position sizes or stepping aside entirely until clearer patterns emerge.
Pro Tip: Regularly review and adjust your strategies based on current market conditions. What worked during the 2025 bull market might fail in 2026’s different environment. Monthly reviews of trading results reveal whether your edge remains intact or if market character shifts demand new approaches. Track not just profit and loss but also whether losses stayed within risk parameters and whether you followed your rules consistently.
Emotional discipline separates successful traders from those who blow up accounts during volatile periods. Volatility triggers fear and greed, tempting you to abandon proven strategies at exactly the wrong moments. Systematic approaches with clear rules remove real-time decision making, letting you execute plans made during calm, rational moments. Accept that some trades will lose, some will win, and your edge emerges over series of trades rather than individual outcomes.
Explore handy.markets for live market insights and alerts
Applying these concepts requires real-time data and responsive tools that keep you connected to market movements across asset classes. Handy.markets delivers comprehensive financial markets tracker and alerts designed specifically for traders who need instant access to price changes and analytical insights.
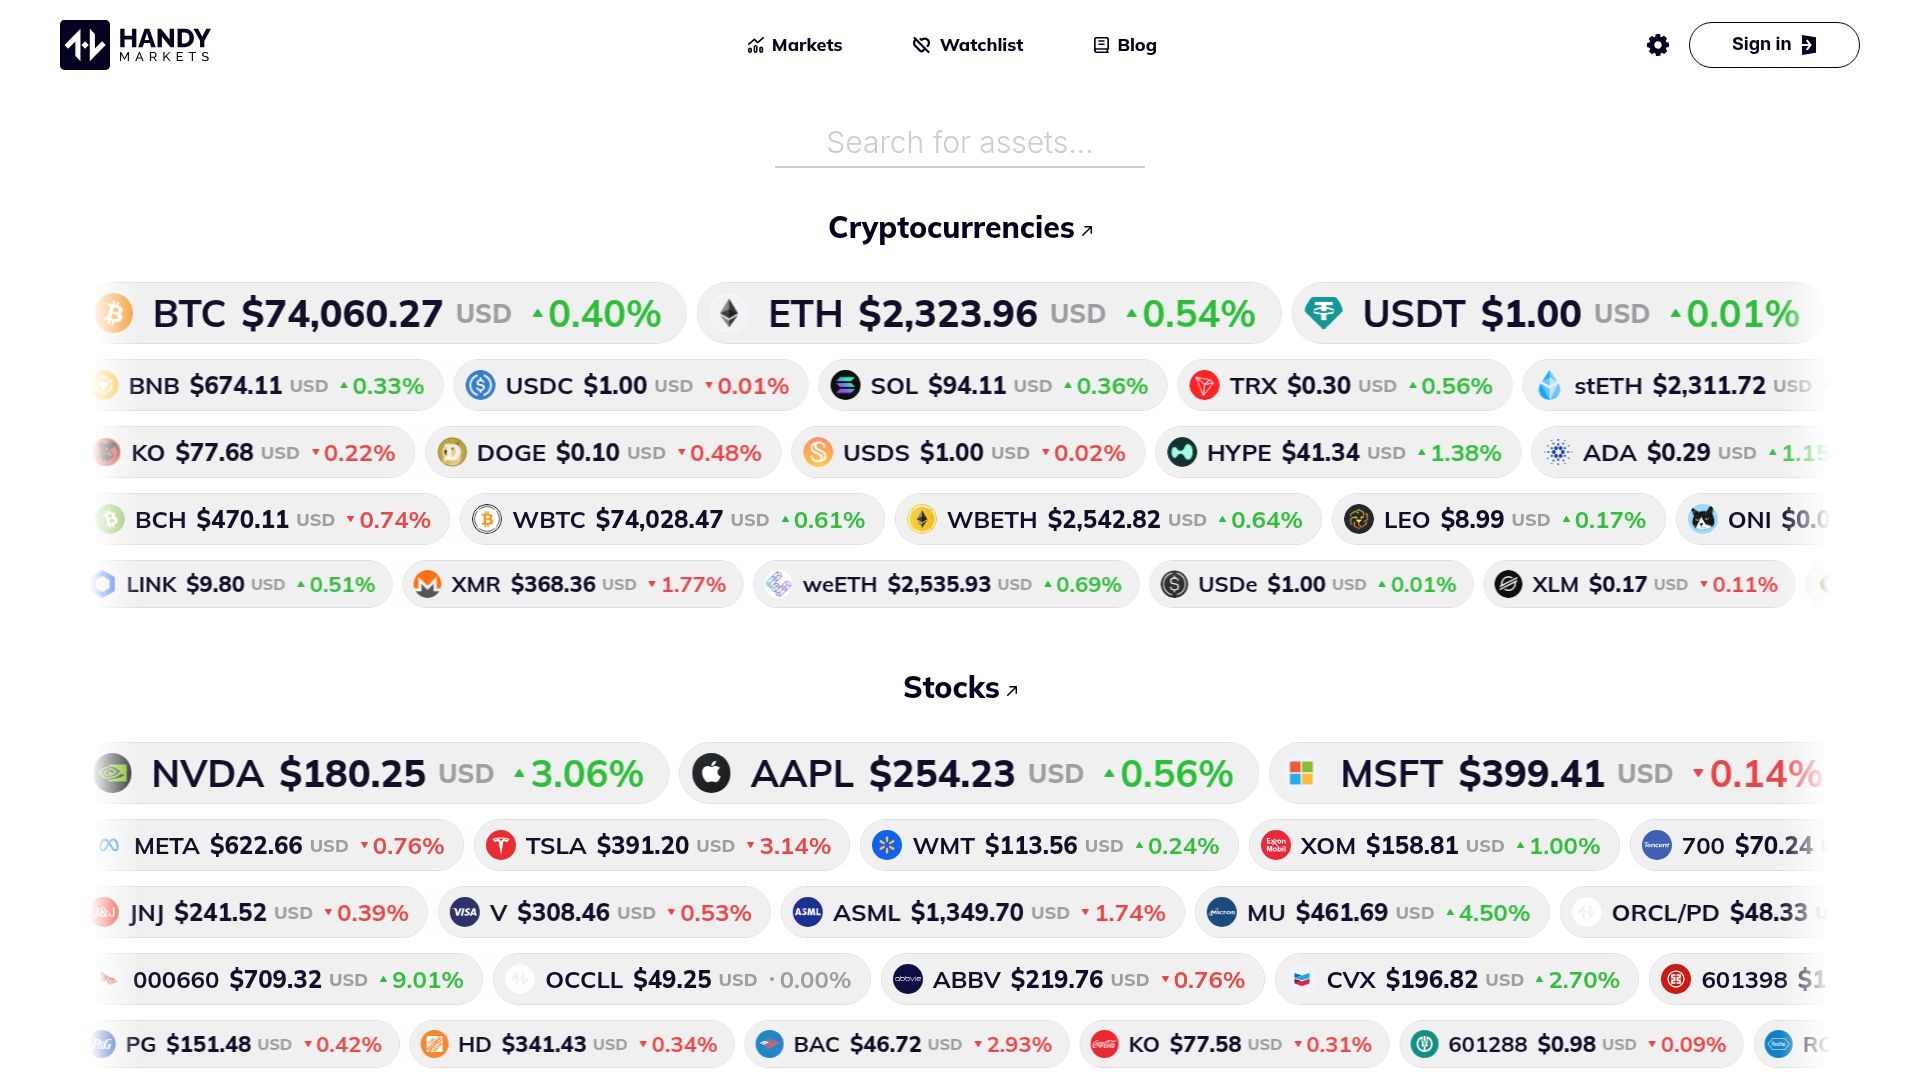
The platform aggregates live stock market data, real-time cryptocurrency prices, commodity quotes, forex rates, and index values in one unified interface. Instead of juggling multiple platforms and subscriptions, you monitor all your markets from a single dashboard. Customizable views let you focus on the specific assets and metrics that matter for your trading approach.
Instant alert notifications across Telegram, Discord, Slack, SMS, email, and webhooks ensure you never miss critical price movements. Configure alerts for percentage changes, absolute price levels, or volume spikes. Whether you’re monitoring a potential breakout in Bitcoin, tracking support levels in tech stocks, or watching for commodity supply disruptions, alerts keep you informed without constant screen watching. The multi-channel delivery means notifications reach you on whatever device or platform you’re currently using, maintaining connection to markets even during busy days away from trading screens.
FAQ
What are market fluctuations?
Market fluctuations are price changes in financial instruments over time, ranging from minor intraday variations to major trend reversals. These movements reflect the continuous recalibration of asset values as traders incorporate new information, shift risk preferences, and respond to economic developments. Understanding fluctuations matters because they create both risks and opportunities. Short-term volatility represents noise around longer-term trends, while sustained directional moves signal fundamental shifts in market conditions. Different assets respond differently to events based on their unique characteristics and participant bases.
How do economic events impact market fluctuations?
Economic announcements like inflation reports, employment data, and interest rate decisions directly influence market liquidity and investor sentiment. Strong employment numbers might boost stocks by signaling economic health but could simultaneously pressure bonds if traders anticipate inflation. Central bank policy changes ripple across all asset classes as they affect borrowing costs, currency values, and risk appetite. Traders watch economic calendars to anticipate these fluctuations, positioning ahead of major releases or waiting for post-announcement clarity before entering trades.
What tools can I use to track and interpret market fluctuations?
Technical indicators like moving averages identify trends by smoothing price noise, while RSI measures momentum to spot overbought or oversold conditions. Alert systems notify traders of sudden price movements, volume spikes, or when assets reach predetermined levels. Handy.markets provides comprehensive market tracking tools with real-time data across stocks, cryptocurrencies, commodities, and forex. Volume analysis confirms whether price moves have conviction, while order book data reveals concentration of buy and sell interest at various levels.
How can understanding market fluctuations improve my trading strategy?
Understanding fluctuations allows better timing for entry and exit points by revealing when assets are overextended or building momentum. This knowledge improves risk management through appropriate position sizing based on volatility characteristics and strategic stop-loss placement at technical levels. Recognizing different market conditions enables strategy adaptation, applying momentum approaches during trends and mean-reversion tactics during ranges. Explore trading strategies for volatile markets to discover approaches suited to current conditions. Informed traders transform volatility from a threat into a strategic advantage by positioning for moves others fear.
Recommended
- Mastering Volatility In Investing: A Beginner’s Guide To Navigating Market Swings In 2025 | Handy.Markets
- Financial Markets: Track Crypto, Stocks, Forex, Indices, Commodities & ETFs Prices With Alerts | Handy.Markets
- Optimism (OP) Price Alerts & Chart | Set Instant Notifications | Handy.Markets
- Threshold (T) Price Alerts & Chart | Set Instant Notifications | Handy.Markets