TL;DR:
- Market indices measure the overall performance of specific market segments, serving as benchmarks and risk gauges.
- They are constructed using different weighting methods, with market-cap weighting being most common but leading to concentration risk.
- Understanding an index’s methodology helps investors make deliberate choices aligned with their investment goals and risk tolerance.
Many traders check the S&P 500 or the Dow Jones every morning like clockwork, yet surprisingly few can explain what those numbers actually represent or why they move the way they do. A market index is more than a scoreboard. It reflects the collective health of a segment of the financial world, and understanding it can sharpen every investment decision you make. This article breaks down what market indices are, how they’re built, and how professionals use them to measure performance and manage risk. By the end, you’ll have a clear framework for reading index movements and putting that knowledge to work.
Table of Contents
- What is a market index?
- How are market indices constructed?
- Major indices: Key examples and differences
- How investors use indices: Benchmarks and analysis
- A fresh look: What most miss about market indices
- Track indices and assets with Handy.Markets
- Frequently asked questions
Key Takeaways
| Point | Details |
|---|---|
| Indices are benchmarks | Market indices provide a reliable way to measure performance and spot trends across market segments. |
| Construction matters | How an index is built—weighting, selection, updates—has a big impact on what it shows and what you can learn from it. |
| Multiple uses | Investors use indices for benchmarking, portfolio tracking, and risk calculation across different asset classes. |
| No direct investment | You cannot buy an index itself, but you can invest in index-based funds or ETFs to track its performance. |
What is a market index?
At its core, a market index is a way of measuring the value of a specific group of assets, usually stocks, bonds, or commodities. Think of it as a snapshot of a particular slice of the market at any given moment. Rather than tracking one company, an index tracks many, giving you a broader view of how a market segment is performing.
The formal definition is straightforward: market indices are hypothetical portfolios that represent segments of financial markets, used both to gauge performance and as benchmarks. The word “hypothetical” is important here. You can’t buy an index directly. It’s a calculated value, not a tradeable asset in itself.
Indices serve several core purposes for traders and investors:
- Benchmarking: Comparing your portfolio’s returns against an index tells you whether you’re keeping pace with the broader market.
- Market gauging: When the S&P 500 drops 3% in a day, it signals broad market stress, not just trouble in one sector.
- Performance tracking: Over time, index trends reveal economic cycles, sector rotations, and investor sentiment shifts.
- Foundation for products: Index funds and ETFs are built to replicate index performance, making indices the backbone of passive investing.
Indices also vary by asset class. Stock indices like the S&P 500 track equities. Bond indices track fixed-income securities. Commodity indices follow raw materials like oil or gold. Each type gives investors a lens into a different part of the financial ecosystem.
“A single index number can tell you more about market sentiment in five seconds than an hour of reading individual stock reports.”
Pro Tip: When you’re evaluating your portfolio’s health, always compare your returns to a relevant index, not just to zero. Beating inflation is good. Beating your benchmark is better.
How are market indices constructed?
Now that you know what market indices are, the next step is understanding how they’re assembled, and why it matters.
Not all indices are built the same way. The methodology behind an index determines which assets are included, how much weight each one carries, and how the index responds to market changes. This is where things get genuinely interesting for investors.
The three main weighting methods are:
- Price-weighted: Each stock’s influence is proportional to its share price. The DJIA uses 30 blue-chip stocks with a price-weighted approach, meaning a $400 stock moves the index more than a $40 stock, regardless of company size.
- Market-cap weighted: Each stock’s weight reflects its total market value. The S&P 500 uses this method and covers roughly 80% of U.S. market cap, making it a much broader representation of the American economy.
- Fundamental-weighted: Stocks are weighted by financial metrics like revenue, earnings, or dividends rather than price or size. This approach is less common but aims to reduce the distortions created by pure market-cap weighting.
| Weighting method | Example index | Key characteristic |
|---|---|---|
| Price-weighted | DJIA | High-price stocks dominate |
| Market-cap weighted | S&P 500 | Largest companies dominate |
| Fundamental-weighted | RAFI indices | Financial metrics drive weight |
Indices don’t stay static. They’re rebalanced periodically, with companies added or removed based on set criteria like market cap thresholds, liquidity, or profitability. When a company is added to the S&P 500, for example, index funds that track it must buy that stock, which can move its price significantly.
One major concern with cap-weighted indices is concentration risk. Market-cap weighting favors mega-caps, meaning a handful of giant companies can account for a disproportionate share of an index’s movement. In recent years, a small group of technology giants has driven a significant portion of S&P 500 returns, which means the index isn’t as diversified as it might appear.
For those exploring stocks or ETFs, understanding weighting is essential before assuming an index fund gives you balanced exposure.

Pro Tip: If you invest in an S&P 500 index fund, check the top 10 holdings. If they make up 30% or more of the fund, you’re more concentrated in mega-cap tech than you might realize.
Major indices: Key examples and differences
To see these principles in action, let’s compare leading indices and what sets them apart.
The three most-watched U.S. stock indices each tell a different story about the market. Understanding their differences helps you choose the right benchmark for your goals.
| Index | Stocks covered | Weighting method | Market cap coverage |
|---|---|---|---|
| S&P 500 | 500 large-cap U.S. companies | Market-cap weighted | ~80% of U.S. equity market |
| DJIA | 30 blue-chip companies | Price-weighted | ~25% of U.S. equity market |
| NASDAQ Composite | 3,000+ companies (tech-heavy) | Market-cap weighted | Broad, tech-focused |
The S&P 500 covers roughly 80% of U.S. equity market cap, while the DJIA covers only about 25%. That gap matters enormously when you’re using an index as a benchmark. The Dow’s 30 stocks simply can’t represent the full breadth of the American economy the way the S&P 500 does.
For most long-term investors, the S&P 500 is the gold standard benchmark. Its annualized return of approximately 14.2% from 2010 to 2020 is the kind of performance figure professionals use when evaluating whether active strategies are worth their fees.
The NASDAQ Composite skews heavily toward technology and growth stocks. It’s a useful lens for tracking innovation-driven sectors, but it also means higher volatility. During tech downturns, the NASDAQ typically falls harder and faster than the S&P 500.
Key practical takeaways:
- Use the S&P 500 as your default benchmark for diversified U.S. equity exposure.
- Watch the DJIA for a quick pulse on blue-chip sentiment, but don’t rely on it for broad market conclusions.
- Follow the NASDAQ Composite if your portfolio is tech-heavy or growth-oriented.
For broader market tracking across multiple asset classes, it helps to monitor several indices simultaneously rather than fixating on just one. You can also use exploring ETFs as a practical way to gain index-linked exposure without buying individual stocks.
How investors use indices: Benchmarks and analysis
So, with the differences between indices clear, how do professionals actually use them?
Indices aren’t just numbers on a screen. They’re tools. Professionals use them in structured ways to measure performance, evaluate risk, and build strategies.
Here’s how the process typically works:
- Set a benchmark. Choose an index that matches your investment universe. A U.S. large-cap portfolio should be measured against the S&P 500, not the NASDAQ.
- Calculate relative returns. If your portfolio gained 10% while the S&P 500 gained 14%, you underperformed by 4 percentage points. That gap is your alpha, or lack of it.
- Measure beta. Beta tells you how much your portfolio moves relative to the index. A beta of 1.2 means your portfolio tends to move 20% more than the index in either direction.
- Use index funds for passive exposure. Rather than picking stocks, many investors simply buy funds that replicate an index. These track the S&P 500’s annualized benchmark returns over time.
- Monitor tracking error. If you’re in an index ETF, tracking error measures how closely the fund follows its index. Lower is better.
Pitfalls to watch for:
- Overreliance on one index can blind you to risks in other markets or asset classes.
- Ignoring tracking error in ETFs can cost you real returns over time.
- Assuming diversification just because you hold an index fund, when concentration risk may still be present.
“The index is the baseline. Everything else is noise until you measure it against that baseline.”
Familiarizing yourself with key trading indicators alongside index data gives you a more complete picture. You can also pair index analysis with market alert strategies to catch major moves early, and explore volatility strategies to manage risk when indices swing hard.
Pro Tip: Track at least three indices across different segments, such as the S&P 500 for large-caps, the Russell 2000 for small-caps, and a bond index, to get a cross-market view of where money is flowing.
A fresh look: What most miss about market indices
After these mechanics, let’s pause and consider what often goes overlooked.
Most investors, and even many advisors, treat index investing as a neutral, risk-free default. It isn’t. The methodology behind any index, its weighting rules, inclusion criteria, and rebalancing schedule, directly shapes the risk and return profile you’re actually taking on. Choosing an index fund is not the same as choosing “the market.”
Mega-cap dominance in cap-weighted indices is a real distortion. When a handful of companies represent a third of an index’s weight, you’re not getting broad market exposure. You’re getting a concentrated bet dressed up as diversification. That’s a subtle but important distinction.
The savvy question isn’t “which index should I follow?” It’s “how is this index built, and does that match what I’m actually trying to achieve?” Investors who ask that question before committing capital tend to make more intentional, better-aligned decisions. Exploring real market trend strategies can help you go beyond surface-level index tracking and build a more deliberate approach to reading market signals.
Track indices and assets with Handy.Markets
Putting your new knowledge into action starts with having the right tools in front of you.
Handy.Markets lets you track global markets across stocks, ETFs, commodities, crypto, and indices, all in one place. You can customize your view to focus on exactly the assets and benchmarks that matter to your strategy. Beyond data, the platform lets you set up price alerts across Telegram, Discord, Slack, SMS, and email, so you’re notified the moment an index or asset hits a level you care about. Whether you’re monitoring the S&P 500 or watching live stock quotes for individual positions, Handy.Markets keeps you informed without the noise.
FAQ
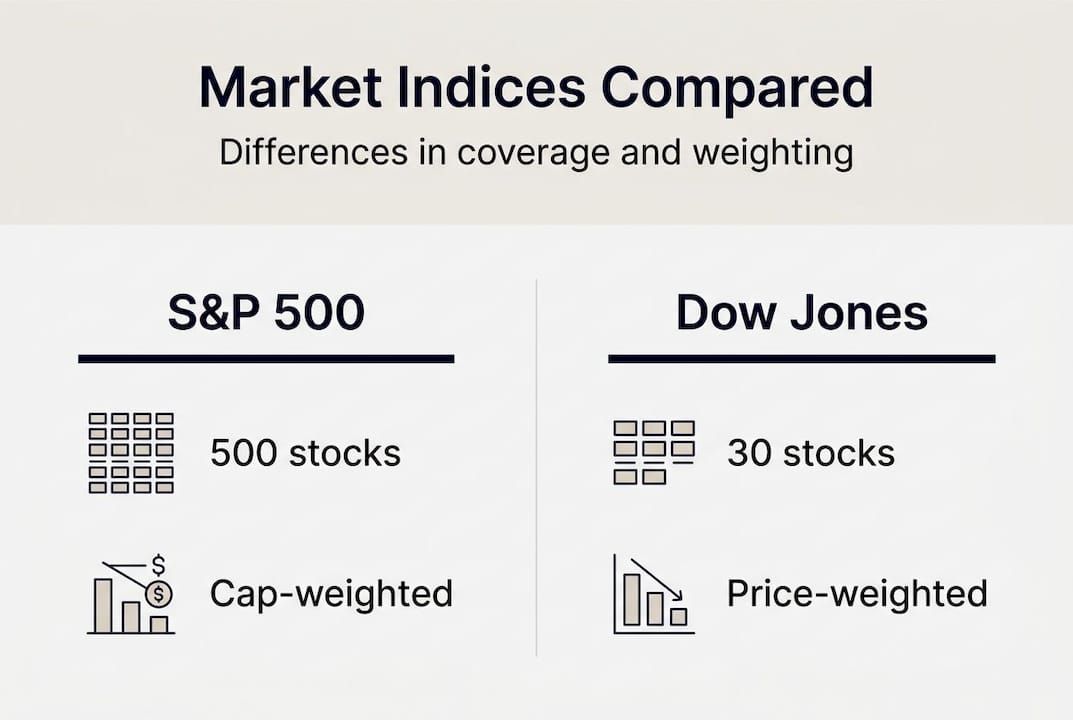
What is the difference between the S&P 500 and the Dow Jones Industrial Average?
The S&P 500 tracks 500 U.S. companies and covers about 80% of U.S. equity market cap, while the DJIA includes only 30 companies and uses price-weighting rather than market-cap weighting, making the S&P 500 a far broader benchmark.
Why do investors use market indices as benchmarks?
Market indices serve as benchmarks for gauging performance, giving investors a standard reference point to evaluate whether their portfolio is keeping pace with, outperforming, or lagging the broader market.
Do market indices include dividends in their returns?
Many standard index figures reflect price returns only and exclude dividends. To see the full picture including reinvested dividends, look for the “total return” version of an index, which is often labeled separately.
Can market indices be invested in directly?
Market indices are hypothetical portfolios, not directly investable instruments. However, index funds and ETFs are designed to replicate an index’s performance, giving investors practical access to index-linked returns.