TL;DR:
- Stock indices measure market performance by tracking groups of stocks, not the entire market itself.
- Calculation methods like market-cap and price weighting influence index movements and risk factors.
- Understanding index construction, rebalancing, and biases helps investors use them more effectively.
When someone says “the market is up today,” they almost always mean a stock index moved higher. Yet many investors treat the S&P 500 or the Dow Jones Industrial Average as interchangeable scorecards, without realizing each index tells a fundamentally different story. Understanding how indices are built, weighted, and maintained is not just academic knowledge. It shapes every benchmarking decision you make, every ETF you evaluate, and every portfolio comparison you draw. We wrote this guide to cut through the confusion and give you a clear, practical foundation for using stock indices as the powerful analytical tools they truly are.
Table of Contents
- What is a stock index?
- How stock indices are built: Calculation methods explained
- Review, rebalancing, and the evolution of indices
- Index investing: How traders and investors use indices
- Nuances, controversies, and what most investors overlook
- What most guides won’t tell you about using stock indices
- Get more from market indices with Handy.Markets
- Frequently asked questions
Key Takeaways
| Point | Details |
|---|---|
| Stock indices are benchmarks | Indices summarize the performance of market segments and guide investment strategy. |
| Weighting methods impact results | How an index calculates weights shapes its market influence and your returns. |
| Indices evolve over time | Regular reviews and rebalancing keep indices relevant as markets change. |
| Passive investing often wins | Index funds tracking major indices historically outperform most active managers. |
What is a stock index?
A stock index is essentially a measuring stick. It tracks the combined value of a specific group of company stocks, giving investors a single number that represents how that group is performing at any given moment. Think of it as the pulse of a market segment, one steady reading that tells you whether conditions are strengthening or weakening.
Stock indices are statistical measures that track the performance of a group of stocks representing a particular market, sector, or segment, serving as benchmarks for investors. That benchmark function is what makes indices so central to modern investing. Mutual fund managers use them to justify their performance. Traders use them to gauge sentiment. And everyday investors use them to understand whether their portfolio is keeping pace with the broader market.
The three most widely followed indices in the U.S. each cover a different slice of the market:
- S&P 500: Tracks 500 large-cap U.S. stocks across multiple sectors, widely regarded as the best single gauge of U.S. equity health.
- Dow Jones Industrial Average (DJIA): Covers 30 blue-chip stocks, making it narrower but historically significant.
- Nasdaq Composite: Includes over 3,000 Nasdaq-listed stocks, heavily weighted toward technology companies.
You can explore how these benchmarks interact with broader markets through our market indices benchmarks guide, or check live stock quotes to see index movements in real time.
“An index is not the market itself. It is a carefully selected, mathematically constructed representation of the market, and that distinction matters enormously for how you interpret its movements.”
Investors use indices in several practical ways:
- Portfolio benchmarking: Comparing your returns against an index helps you assess whether active decisions are adding value.
- Sentiment reading: A broad index rising or falling signals overall investor confidence.
- Sector analysis: Sector-specific indices reveal which parts of the economy are leading or lagging.
- Product selection: Index funds and ETFs are built directly around these benchmarks.
Understanding key market indicators alongside indices gives you a richer picture of market conditions than any single number can provide.
How stock indices are built: Calculation methods explained
Knowing what a stock index is, it’s essential to understand the math under the hood because how an index is calculated directly affects what it tells you and how you should use it.
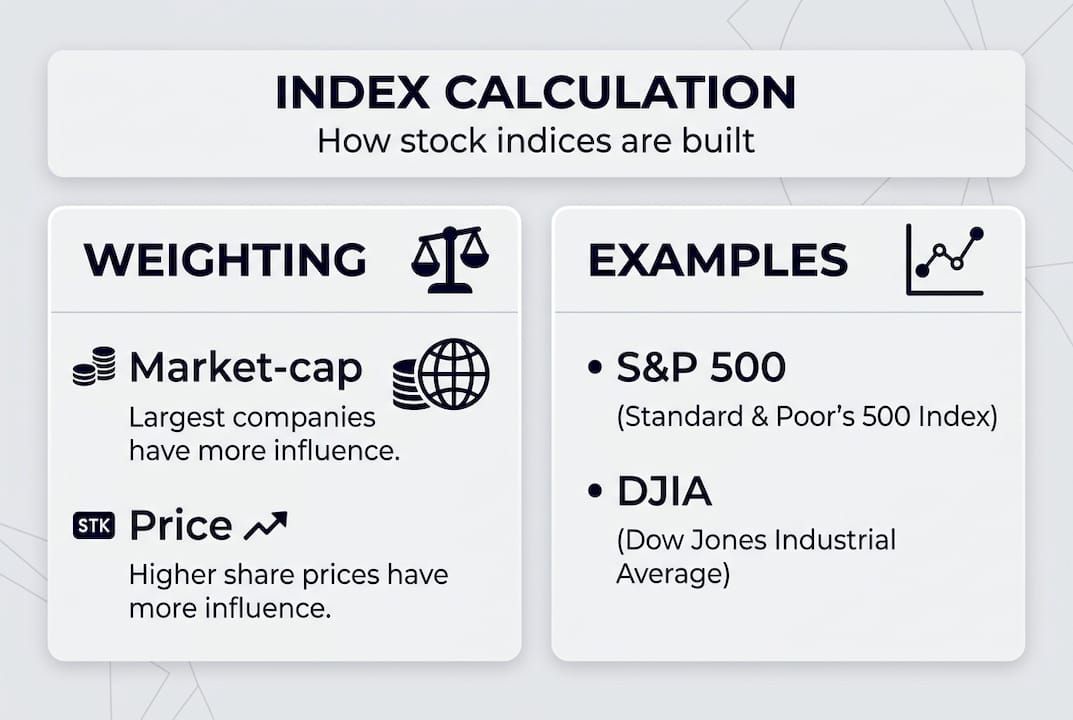
Primary calculation methodologies include market-cap weighting, where the index equals the sum of each stock’s price multiplied by its share count, divided by a divisor, and price weighting, where the index equals the sum of all stock prices divided by a divisor. These two approaches produce very different results.
| Method | Example | How it works | Key implication |
|---|---|---|---|
| Market-cap weighted | S&P 500 | Larger companies carry more weight | Mega-caps dominate movements |
| Price-weighted | DJIA | Higher-priced stocks carry more weight | A stock split can distort the index |
| Equal-weighted | Some alternatives | Every stock counts equally | Small-caps have outsized influence |
| Fundamental-weighted | RAFI indices | Weight by earnings, sales, or dividends | Less momentum bias |
The index divisor is a crucial concept that most guides skip over. When a company in the index splits its stock or pays a special dividend, the raw price changes without any real economic event occurring. The divisor is adjusted to neutralize that distortion, keeping the index consistent over time. You can review the S&P calculation methodology directly for the full mathematical framework.
Here is a simplified look at how index construction flows:
- Define the universe: Which stocks are eligible based on market cap, liquidity, and domicile.
- Apply the weighting method: Assign each stock its relative weight in the index.
- Calculate the index level: Use the formula appropriate to the weighting method.
- Adjust the divisor: Account for corporate actions to maintain continuity.
- Review and rebalance: Update components periodically to reflect market changes.
For more on index construction details, our in-depth guide walks through how these mechanics affect the indices you track every day.
Pro Tip: In a market-cap weighted index like the S&P 500, the five largest companies can account for more than 25% of the entire index weight. That means a single earnings miss from a mega-cap stock can move the whole index, even if the other 495 companies are doing fine. Always check concentration before assuming an index is truly diversified.
Review, rebalancing, and the evolution of indices
Once you understand index formulas, you’ll see why indices can’t stay static. Markets evolve, companies grow or shrink, and sectors rise and fall. A well-designed index must adapt to remain a meaningful benchmark.
Rebalancing occurs quarterly for many indices, with the S&P U.S. indices reviewed at the end of March, June, September, and December. Additions and deletions are based on market cap, liquidity, and sector balance. This is not a minor housekeeping exercise. It can move billions of dollars as index funds are forced to buy newly added stocks and sell removed ones.

Here is what typically triggers a review decision:
| Trigger | Effect on index |
|---|---|
| Company market cap falls below threshold | Potential deletion |
| IPO meets eligibility criteria | Potential addition |
| Merger or acquisition | Removal of acquired company |
| Sector imbalance detected | Weighting adjustment |
| Sustained low liquidity | Deletion consideration |
The process for deciding additions and deletions involves an index committee that evaluates candidates against published criteria. It is not purely mechanical. Judgment calls happen, and that introduces a subtle but real element of human discretion into what many assume is a purely objective system.
For investors holding index funds or ETFs, rebalancing periods matter in specific ways:
- Front-running risk: Traders anticipate which stocks will be added and buy ahead of the official change, inflating the price that index funds must pay.
- Tracking error spikes: Around rebalancing dates, ETF tracking error can temporarily widen.
- Tax implications: Funds may realize capital gains when selling deleted components.
- Opportunity awareness: Stocks removed from major indices often experience short-term price drops that may not reflect their fundamental value.
Monitoring market volatility strategies during rebalancing windows can help you navigate these temporary disruptions with more confidence.
Index investing: How traders and investors use indices
With index mechanics and reviews in mind, let’s move to the practical side: how you can use indices to shape your portfolio and measure performance.
The most direct application is benchmarking. If your portfolio returned 9% last year and the S&P 500 returned 12%, you underperformed your benchmark. That gap is a signal worth investigating, not ignoring. Benchmarking forces honest self-assessment, which is one of the most valuable habits any investor can develop.
The rise of index funds and ETFs has made index investing accessible to virtually everyone. Passive index funds have consistently outperformed active managers over long periods, with SPIVA data showing roughly 90% of active funds underperforming their benchmark over 15 years. That is a striking number, and it explains why index investing has grown so dramatically.
Key advantages of index-based investing include:
- Lower costs: Index funds typically charge a fraction of what active funds charge in annual fees.
- Broad diversification: A single S&P 500 fund gives you exposure to 500 companies across multiple sectors.
- Transparency: You always know what you own because the index methodology is public.
- Tax efficiency: Lower turnover means fewer taxable events compared to actively managed funds.
You can browse ETFs live data to compare index-tracking products, or track indices across asset classes to inform your allocation decisions. For broader context, our investment strategies 2026 guide covers how indices fit into current market conditions.
Pro Tip: Tracking error measures how closely an ETF follows its target index. A low tracking error (under 0.10%) means the fund is replicating the index faithfully. A higher tracking error suggests the fund is using sampling or derivatives, which introduces additional uncertainty. Always check tracking error before selecting an ETF for long-term holding.
Nuances, controversies, and what most investors overlook
Popular as indices are, their construction produces subtle biases that even experienced investors sometimes miss. Understanding these nuances helps you use indices more critically and avoid costly assumptions.
Divisor adjustments for corporate actions such as stock splits and special dividends are designed to maintain index continuity, but they also mean the index level is not a pure reflection of aggregate stock prices. Float adjustment, which excludes closely-held shares from the calculation, ensures the index reflects only shares actually available for trading. Some indices also apply capping rules to limit how much any single stock can dominate the weighting.
Here are the most commonly overlooked issues:
- Concentration risk in cap-weighted indices: The top 10 stocks in the S&P 500 can represent a disproportionate share of total weight, meaning the index is less diversified than it appears.
- Price-weighted distortion: In the DJIA, a $500 stock influences the index five times more than a $100 stock, regardless of company size or economic importance.
- Survivorship bias: Indices only include current members. Companies that failed or were removed are not part of the historical record, which can make past index performance look better than the actual investing experience was.
- Sector drift: As certain sectors grow, their weight in the index grows too, which can shift your exposure without you making any active decision.
“Price-weighted indices like the DJIA are criticized for not reflecting economic size, while cap-weighted indices are prone to concentration risk in mega-caps, raising legitimate questions about which design best serves investors.”
Some researchers and practitioners advocate for fundamental weighting approaches, where stocks are weighted by earnings, book value, or dividends rather than market price. This approach aims to reduce momentum bias and concentration risk, though it introduces its own tradeoffs. Exploring stock market trend insights alongside index construction debates can sharpen your analytical edge considerably.
What most guides won’t tell you about using stock indices
Here is a hard-earned truth: the index you choose to benchmark against shapes your entire perception of success or failure. Most investors default to the S&P 500 without asking whether it is actually the right benchmark for their portfolio. If you hold significant international stocks, small-cap equities, or bonds, comparing yourself to the S&P 500 is like measuring a marathon runner against a sprinter. The comparison is misleading by design.
Professional traders use index reports differently than most retail investors. They watch index rebalancing schedules, monitor changes in constituent weights, and track the gap between price-weighted and cap-weighted readings to detect divergences that signal shifting market dynamics. That layered reading is far more informative than simply noting whether the index went up or down.
We also encourage you to question any new index product before investing. Ask: who constructed it, what methodology do they use, and how long is the live track record versus the backtested history? Backtested indices almost always look better than real-world performance because they are built with hindsight. Our in-depth market index analysis can help you evaluate these questions with confidence.
Get more from market indices with Handy.Markets
You now have a solid foundation for reading, evaluating, and applying stock indices to your investment decisions. The next step is putting that knowledge to work with real-time data at your fingertips.
At Handy.Markets, you can track financial markets across stocks, indices, cryptocurrencies, and more, all in one place. Whether you want to monitor index movements as they happen or set up price alerts that notify you via Telegram, Discord, Slack, SMS, or email, the platform keeps you informed without the noise. You can also follow crypto price alerts alongside your index tracking for a truly diversified market view. Staying ahead of index moves has never been more straightforward.
FAQ
How is the S&P 500 different from the Dow Jones Industrial Average?
The S&P 500 uses float-adjusted market cap weighting and tracks 500 large U.S. stocks, while the DJIA is price-weighted and covers only 30 major companies, making each index a very different lens on market performance.
Why do stock indices need to be rebalanced?
Indices are rebalanced to stay current with market realities. Quarterly rebalancing ensures additions and deletions reflect changes in market cap, liquidity, and sector representation, keeping the benchmark accurate and relevant.
What’s the difference between an index fund and an ETF?
Both track an index, but ETFs trade on an exchange throughout the day like individual stocks, while index funds are priced once at market close and transacted directly through the fund provider.
Do all indices use the same calculation method?
No. Primary methodologies include market-cap weighting, price weighting, equal weighting, and fundamental weighting, each producing different results and carrying different risks for investors who rely on them as benchmarks.