Many traders believe effective market monitoring requires expensive tools, advanced coding skills, or constant screen time. The reality is simpler. Modern platforms deliver real-time data and automated alerts across stocks, crypto, commodities, and forex without technical barriers. You can track price movements, detect volatility shifts, and respond to opportunities faster than ever. This guide walks you through the core technologies, quantitative methods, and practical strategies that power today’s market monitoring systems, helping you make informed decisions with confidence.
Table of Contents
- Key takeaways
- Understanding real-time market data acquisition and alert systems
- Classifying market volatility and detecting regimes with real-time analytics
- Quantitative methods for arbitrage detection and alpha extraction in streaming data
- Practical strategies and best practices for implementing market monitoring systems
- Enhance your market monitoring with Handy.Markets
- What is market monitoring and why is it important?
Key Takeaways
| Point | Details |
|---|---|
| Real time data alerts | Modern platforms provide continuous real time data streams and automated alerts across assets to spot opportunities quickly. |
| Centralized asset monitoring | A single dashboard lets you track equities, crypto, commodities, indices, and forex with independent alert rules, reducing screen switching. |
| Volatility regime awareness | Real time analytics classify calm, elevated, and crisis market states to guide adaptive strategies. |
| Rule based alerts | Rule engines evaluate conditions such as price thresholds and volume spikes, and you should test rules with historical data before deploying. |
Understanding real-time market data acquisition and alert systems
Effective market monitoring starts with continuous data streaming and intelligent alert mechanisms. Real-time equity price alert systems use WebSocket protocols to maintain persistent connections between your system and market data feeds, ensuring you receive price updates the moment they occur. Unlike traditional polling methods that check for changes at intervals, WebSocket delivers instant push notifications, reducing latency to milliseconds.
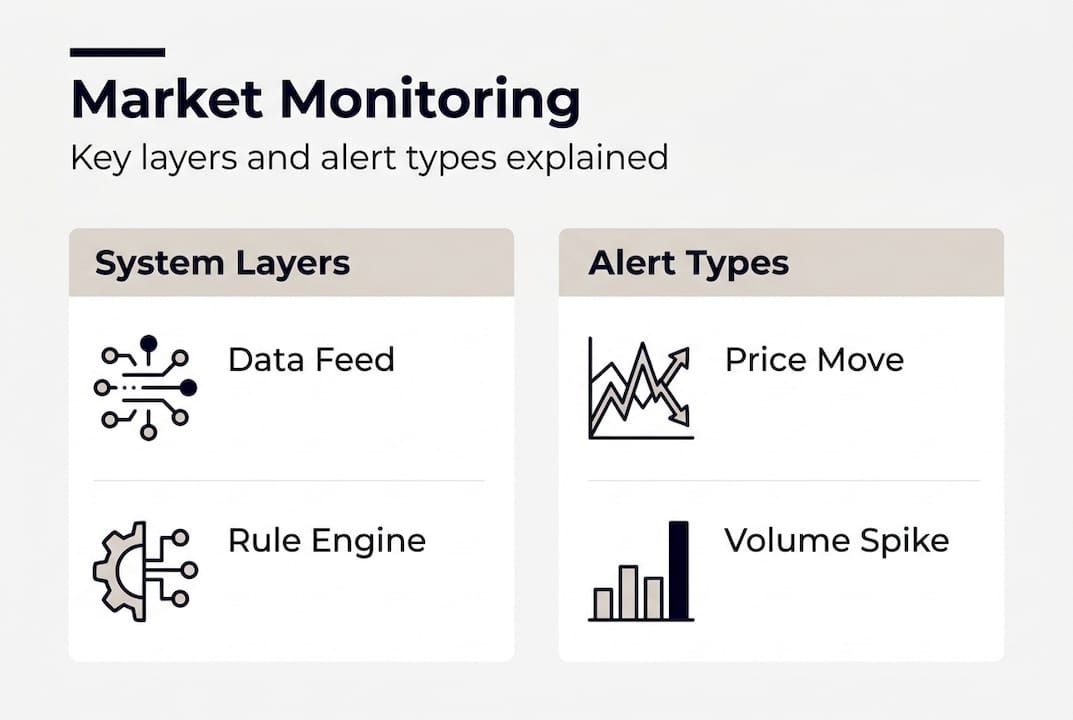
The architecture behind these systems typically includes three layers. Data acquisition connects to exchanges and brokers via APIs, pulling live prices, volumes, and order book depth. Processing engines apply your custom rules, such as price crossing a threshold, percentage changes exceeding limits, or volume spikes indicating unusual activity. Alert dispatching sends notifications through your preferred channels, whether email, Telegram, Discord, or SMS.
Rule engines form the intelligence layer, evaluating conditions you define. You might set an alert when Bitcoin drops 5% in 30 minutes, or when a stock’s trading volume exceeds its 20-day average by 200%. These conditions run continuously against incoming data streams, triggering notifications only when criteria match. This automation eliminates the need to watch screens constantly while ensuring you never miss critical movements.
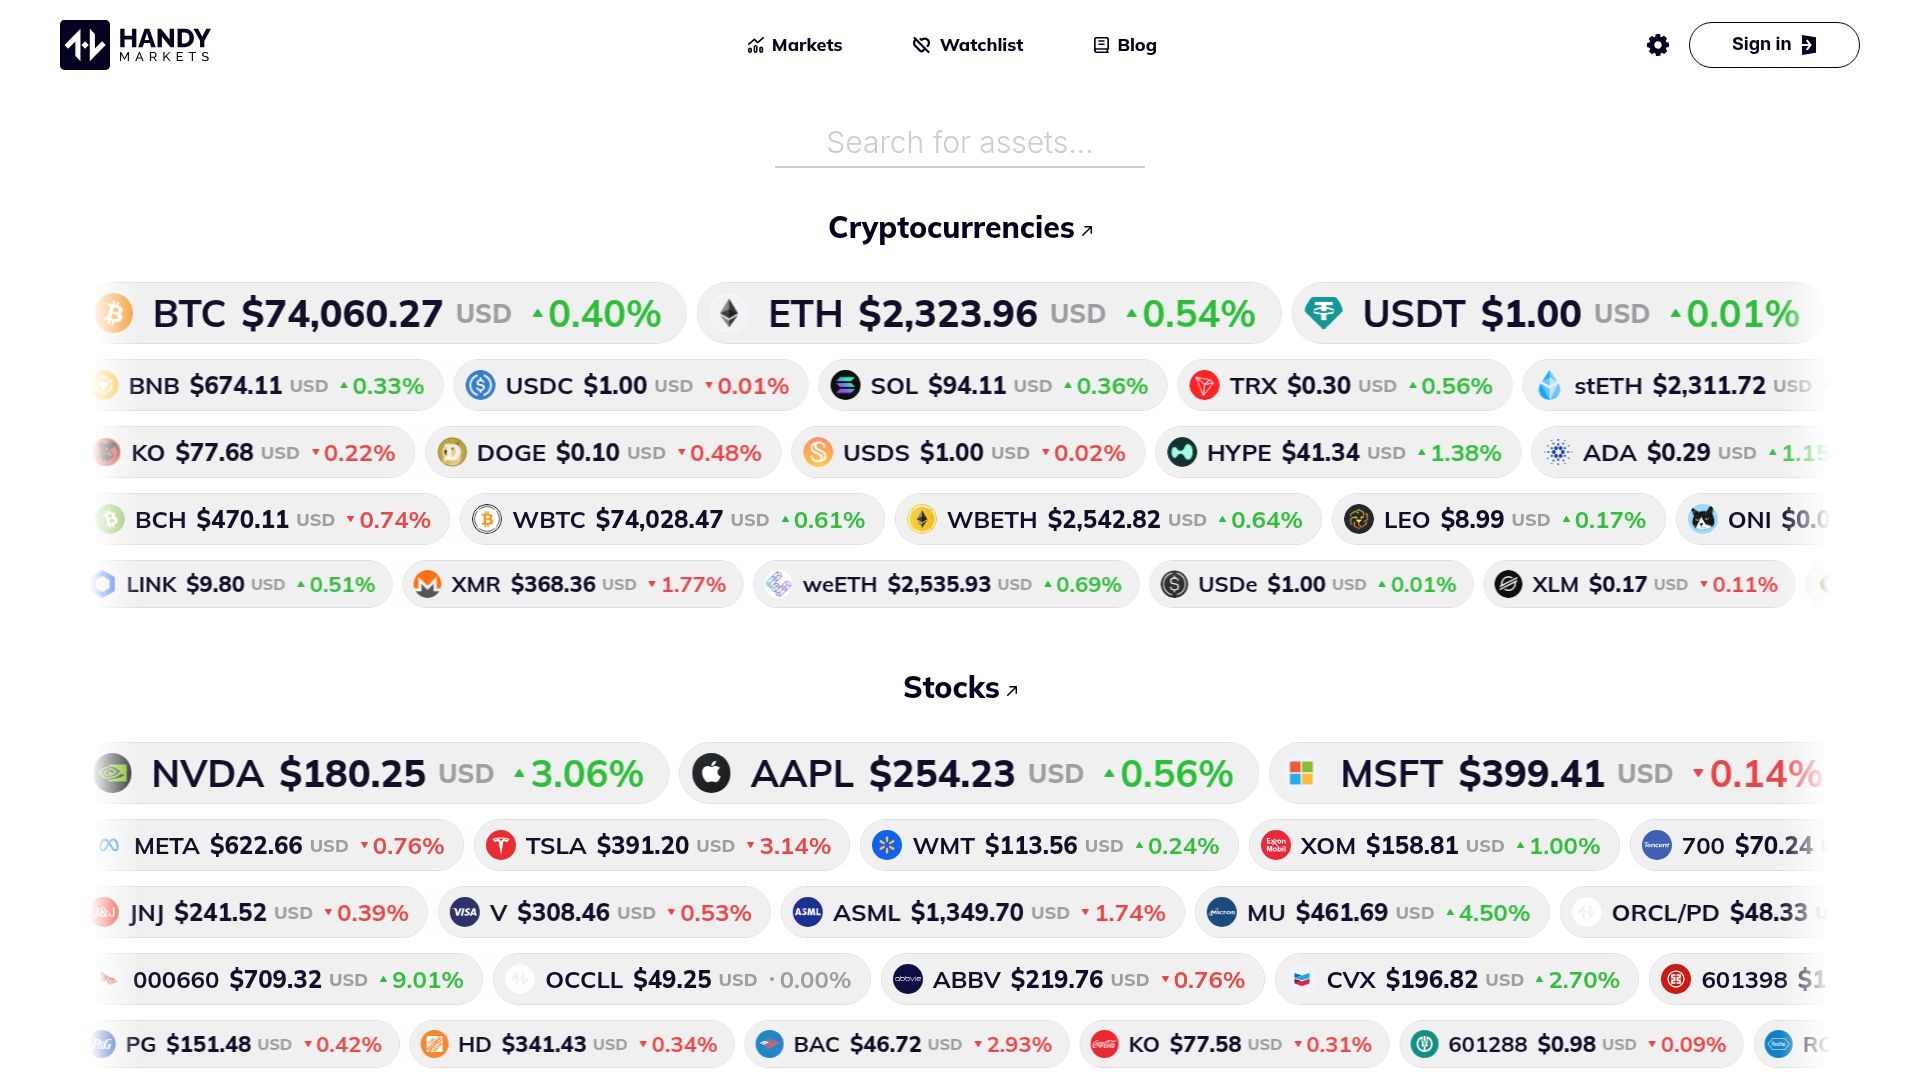
Modern market price alert systems support multi-asset monitoring from a single interface. You can track equities, cryptocurrencies, commodities, indices, and forex pairs simultaneously, with each asset having independent alert rules. This centralization simplifies portfolio oversight and reduces the cognitive load of switching between platforms.
Pro Tip: Start with simple price threshold alerts before adding complex conditions. Test your rules with historical data to verify they trigger at the right moments without generating excessive noise.
- WebSocket protocols maintain persistent connections for instant data delivery
- Rule engines evaluate custom conditions like price thresholds and volume anomalies
- Multi-channel notifications reach you via email, Telegram, SMS, and webhooks
- Centralized dashboards consolidate monitoring across diverse asset classes
Classifying market volatility and detecting regimes with real-time analytics
Markets shift between distinct behavioral states, from calm periods with tight price ranges to explosive volatility during news events or crises. Volatility regime monitoring classifies these states using real-time tick data and statistical models, helping you adjust your strategy to current conditions rather than fighting against market character.
Three primary regimes characterize most markets. Calm regimes feature low volatility, narrow spreads, and predictable price action, favoring mean reversion strategies. Elevated volatility regimes show wider price swings and increased trading volume, creating opportunities for momentum plays but requiring wider stops. Crisis regimes exhibit extreme moves, liquidity gaps, and correlation breakdowns, demanding defensive positioning or complete exit from certain positions.

Markov switching models and machine learning classifiers identify these regimes by analyzing price variance, order book depth, and trade frequency patterns. These models update continuously as new data arrives, providing real-time regime classification rather than lagged assessments. When volatility transitions from calm to elevated, your system can automatically adjust position sizing, tighten risk controls, or send alerts prompting manual review.
Order book data enhances regime detection by revealing supply and demand imbalances before they manifest in price. A sudden thinning of bid depth might signal an impending volatility spike, while balanced book depth across multiple price levels suggests stability. Combining price-based volatility measures with microstructure signals improves classification accuracy and reduces false regime switches.
Volatility regime monitoring techniques enable dynamic risk management. Instead of applying fixed position sizes regardless of conditions, you scale exposure inversely to volatility. During calm regimes, you might increase position size to capitalize on lower risk. When volatility elevates, you reduce exposure to maintain consistent dollar risk per trade.
Pro Tip: Track regime persistence alongside current classification. Markets that recently transitioned into high volatility often remain volatile longer than expected, while extended calm periods can precede explosive moves.
| Regime Type | Characteristics | Optimal Strategies |
|---|---|---|
| Calm | Low volatility, tight spreads, predictable patterns | Mean reversion, larger positions, tighter stops |
| Elevated Volatility | Wider swings, increased volume, trending behavior | Momentum plays, reduced size, wider stops |
| Crisis | Extreme moves, liquidity gaps, correlation breakdown | Defensive positioning, cash preservation, hedging |
- Markets cycle through calm, elevated volatility, and crisis regimes
- Markov switching and ML classifiers identify current regime from tick data
- Order book depth reveals supply/demand imbalances before price moves
- Dynamic position sizing adjusts exposure based on regime classification
Quantitative methods for arbitrage detection and alpha extraction in streaming data
Advanced quantitative techniques uncover hidden opportunities in real-time market data that discretionary analysis misses. No-arbitrage violation detection uses GLR-CUSUM stopping rules to identify pricing inconsistencies across related instruments, such as futures and their underlying assets or currency cross rates that deviate from triangular parity.
The GLR-CUSUM method applies sequential hypothesis testing to streaming price data, detecting structural breaks that signal arbitrage opportunities. When the cumulative sum of log-likelihood ratios exceeds a threshold, the algorithm flags a potential violation. This approach works in high-frequency environments where opportunities exist for seconds or milliseconds, requiring immediate detection and execution.
AI-driven pattern recognition extends beyond simple arbitrage to extract alpha and beta signals from complex market structures. AI alpha beta extraction employs shape-based time series analysis to identify recurring price patterns that precede directional moves. These systems learn from historical data which formations reliably predict future behavior, then scan streaming data for matching shapes.
GPU acceleration makes real-time analysis feasible at scale. Processing millions of price updates per second across hundreds of instruments exceeds CPU capabilities, but parallel GPU architecture handles these workloads efficiently. This computational power enables sophisticated statistical tests and pattern matching to run continuously without introducing latency that would negate any discovered edge.
These quantitative methods optimize execution by identifying optimal entry and exit points. When arbitrage detection spots a mispricing, execution algorithms can immediately route orders to capture the spread before it closes. Pattern recognition signals inform discretionary traders when technical setups align with historical precedent, improving win rates and risk-adjusted returns.
- Implement GLR-CUSUM algorithms to monitor related instruments for pricing inconsistencies
- Train machine learning models on historical data to recognize profitable patterns
- Deploy GPU-accelerated infrastructure to process streaming data without latency
- Integrate detection signals with execution systems for immediate order routing
- Continuously backtest and refine models as market microstructure evolves
| Method | Application | Data Requirements | Computational Needs |
|---|---|---|---|
| GLR-CUSUM | Arbitrage violation detection | High-frequency tick data | Moderate CPU |
| Shape Recognition | Alpha signal extraction | Historical patterns, streaming prices | High GPU |
| Statistical Arbitrage | Mean reversion trading | Cointegrated pairs, volatility | Moderate CPU |
These techniques require robust data infrastructure and testing frameworks. Arbitrage detection in market data and AI-driven alpha beta extraction benefit from clean, normalized feeds across multiple venues, ensuring your algorithms operate on accurate information. Systematic backtesting validates that detected signals translate to profitable trades after accounting for transaction costs, slippage, and execution delays.
Practical strategies and best practices for implementing market monitoring systems
Building effective monitoring systems requires attention to data quality, infrastructure scalability, and operational discipline. Traders should monitor order book and trade data across multiple venues to avoid gaps that create blind spots. A stock might trade on several exchanges simultaneously, and monitoring only one venue means missing significant volume and price discovery occurring elsewhere.
Vigilance against manipulative small limit orders protects profitability and system integrity. High-frequency trading strategy efficiency depends on detecting spoofing, layering, and other deceptive practices that distort order book signals. Your monitoring system should flag unusual patterns like rapid order placement and cancellation, or large orders that disappear when price approaches.
Scalable infrastructure handles high message rates during volatile periods without degrading performance. Markets can generate millions of updates per second during major events, and your system must process this flood without dropping messages or introducing latency. Cloud-based solutions offer elastic scaling, automatically adding compute resources when load increases, then scaling down during quiet periods to control costs.
Systematic testing ensures your monitoring framework operates reliably under all conditions. Simulate various market scenarios, from normal trading to flash crashes, verifying that alerts trigger correctly and data feeds remain stable. Regulatory compliance requires maintaining audit trails of all alerts and system decisions, so implement logging that captures timestamps, trigger conditions, and notification delivery status.
Market surveillance challenges and standards reveal that data gaps and integration issues affect over 30% of jurisdictions, emphasizing the importance of robust multi-venue monitoring. Your system should reconcile data from different sources, handling format differences and time zone conversions automatically. Redundant data feeds provide backup when primary sources experience outages.
Pro Tip: Implement alert throttling to prevent notification fatigue. If a condition triggers repeatedly within minutes, consolidate updates into periodic summaries rather than sending dozens of individual messages.
- Monitor order books across all venues where your instruments trade
- Detect manipulative order patterns that distort market signals
- Deploy scalable infrastructure that handles peak message rates without degradation
- Maintain comprehensive audit trails for compliance and system analysis
- Use redundant data feeds to ensure continuous monitoring during outages
Start with a focused set of instruments and alert rules, then expand gradually as you validate performance. Many traders overwhelm themselves by monitoring too many assets with overly sensitive alerts, creating noise that obscures genuine opportunities. Focus on your core trading universe and refine thresholds until your system delivers actionable signals without false positives.
Regular system reviews identify optimization opportunities. Analyze which alerts led to profitable trades versus those ignored or resulting in losses. Adjust rules based on this feedback, tightening conditions that generate too many false signals or loosening those that miss important moves. Your monitoring system should evolve alongside your trading strategy and market conditions.
Enhance your market monitoring with Handy.Markets
Now that you understand how market monitoring works, implementing these concepts becomes straightforward with the right platform. Handy.Markets delivers real-time market tracking across stocks, cryptocurrencies, forex, and commodities from a single interface, eliminating the need to juggle multiple tools or write custom code.
You can customize notifications to match your exact trading strategy, setting price thresholds, percentage changes, and volume triggers for any asset. Alerts reach you through Telegram, Discord, Slack, email, SMS, or webhooks, ensuring you stay informed regardless of where you are or which devices you use. The platform handles data acquisition, processing, and notification delivery automatically, letting you focus on analysis and execution rather than infrastructure management.
Whether you trade cryptocurrency price alerts or monitor stock price alerts, the intuitive dashboard consolidates everything in one place. Set up your first alerts in minutes, then refine your monitoring as you discover which signals drive your best decisions.
What is market monitoring and why is it important?
What does market monitoring involve?
Market monitoring means continuously tracking price, volume, order book depth, and related data across financial instruments. It informs traders when significant changes occur, enabling quick responses to opportunities or risks. Without systematic monitoring, you rely on manual checks that inevitably miss important moves.
How do real-time alert systems improve trading strategies?
Alerts notify traders instantly about important market events like price breakouts, volume spikes, or volatility shifts. They support proactive decision making rather than reactive scrambling after moves have already occurred. This speed advantage often determines whether you capture profitable opportunities or arrive too late.
What technologies power modern market monitoring?
WebSocket protocols provide continuous data streaming with minimal latency, replacing older polling methods. Rule engines automate condition-based alerts, evaluating your criteria against every price update. AI detects complex patterns and anomalies that simple threshold rules miss, uncovering hidden opportunities in market microstructure.
How can traders implement effective market monitoring without coding experience?
Platforms like Handy.Markets offer intuitive interfaces for setting up alert systems without programming knowledge. You select assets, define conditions using simple forms, and choose notification channels through point-and-click configuration. The platform handles all technical complexity behind the scenes, making sophisticated monitoring accessible to every trader.
Recommended
- Financial Markets: Track Crypto, Stocks, Forex, Indices, Commodities & ETFs Prices With Alerts | Handy.Markets
- Threshold (T) Price Alerts & Chart | Set Instant Notifications | Handy.Markets
- MANTRA (OM) Price Alerts & Chart | Set Instant Notifications | Handy.Markets
- Eclipse (ES) Price Alerts & Chart | Set Instant Notifications | Handy.Markets
- MARKET INSIGHTS | GALAMI GOLD