TL;DR:
- A market data analysis workflow is a structured, repeatable process for collecting, cleaning, analyzing, validating, and interpreting financial data. It ensures accuracy, saves time, and produces reliable insights across different market conditions. Automated tools like AI systems and orchestration frameworks help streamline each stage for faster, more consistent results.
A workflow for market data analysis is a systematic, repeatable process that guides analysts through collecting, cleaning, analyzing, validating, and interpreting financial data to support sound decision-making. Without a defined process, even experienced analysts waste hours on rework, miss critical signals, and produce results that cannot be reproduced. In 2026, AI-augmented tools like DataToBrief and orchestration frameworks like Apache Airflow have made it possible to compress what once took a full workday into minutes. This guide walks you through every stage of an effective market analysis workflow, from raw data ingestion to validated insight delivery, so you can build a process that holds up across asset classes and market conditions.
What are the essential steps in a market data analysis workflow?
A structured data analysis process is the difference between a one-off report and a repeatable system that compounds in value over time. The industry term for this end-to-end process is the analytics pipeline, and each stage feeds directly into the next.
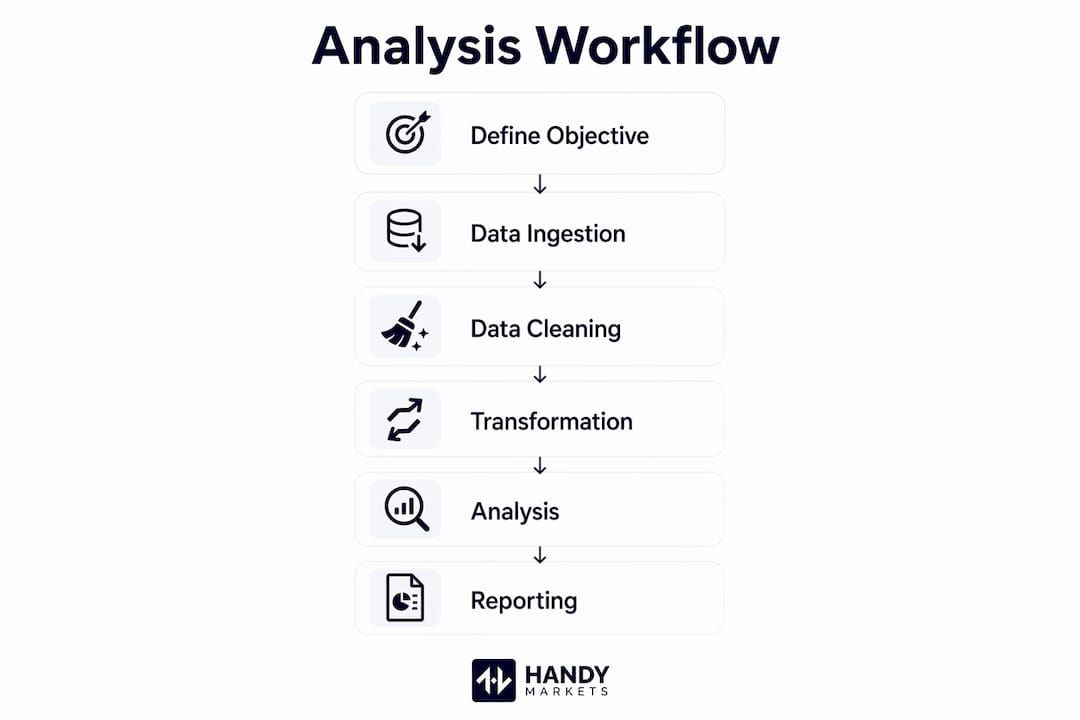
- Define the problem and objectives. State exactly what question you are answering before touching any data. Are you measuring equity momentum, credit spread widening, or commodity seasonality? A vague objective is the single biggest predictor of project failure.
- Collect data from multiple sources. Pull from SEC EDGAR filings, Federal Reserve Economic Data (FRED), Bureau of Labor Statistics (BLS) releases, earnings call transcripts, and alternative data feeds. Prioritize secondary sources like FRED and BLS first to build a cost-effective baseline before commissioning expensive primary research.
- Clean and prepare the data. Data cleaning consumes up to 80% of total project time. Automating validation rules and standardizing formats with tools like dbt Core prevents that cost from repeating on every project cycle.
- Analyze using statistical and exploratory techniques. Run exploratory data analysis (EDA) before building any model. Calculate descriptive statistics, check distributions, and identify outliers. Tools like Python’s pandas and statsmodels libraries handle this efficiently at scale.
- Validate results rigorously. Test your findings across multiple time periods and market regimes. Out-of-sample validation is not optional. It is the only way to know whether a signal is real or a statistical artifact.
- Interpret and communicate insights. Translate findings into clear recommendations. Use Metabase or a comparable visualization tool to present results, but remember that the dashboard is the output, not the analysis itself.
Pro Tip: Write your problem statement as a single sentence before opening any data file. If you cannot state the question in one sentence, the scope is too broad.
Which tools support an efficient market data analysis process?
The right tool stack turns a fragile manual process into a production-grade system. Each stage of the market analysis workflow maps to a specific category of tooling.

| Stage | Tool Examples | Primary Purpose | Automation Level |
|---|---|---|---|
| Data ingestion | Python scripts, DataToBrief | Pull data from APIs and filings | Medium to high |
| Transformation | dbt Core | Clean, model, and version data | High |
| Orchestration | Apache Airflow | Schedule and monitor pipeline tasks | High |
| Storage | PostgreSQL | Store structured financial datasets | Low (setup only) |
| Visualization | Metabase | Build dashboards and reports | Medium |
| Agentic research | AutoGPT workflows | Chain multi-step research tasks | Very high |
AI-powered agentic systems deserve special attention here. AutoGPT-style workflows can chain source retrieval, first-pass comparison, and memo drafting into a single automated sequence. That is a meaningful shift for equity research teams that previously spent hours on each briefing cycle.
The open-source versus commercial choice matters for budget and control. dbt Core, Apache Airflow, and PostgreSQL are all open-source and widely adopted in institutional finance. Metabase offers both an open-source tier and a paid cloud version. For teams that need managed infrastructure, commercial data warehouse options like Snowflake or BigQuery integrate cleanly with the same orchestration layer.
Pro Tip: Start with dbt Core for transformation even if your data volume is small. The version control and testing features pay off immediately when you need to audit a result or hand off a project.
How to build an automated market data pipeline
Automation converts your market data analysis techniques from a manual checklist into a self-running system. The goal is a pipeline that ingests, validates, and delivers clean data without human intervention on every cycle.
Here is a practical build sequence:
- Define your ingestion cadence. Most production pipelines run on a fixed daily schedule. Scheduled tasks at fixed intervals, such as 6 PM EST, prepare data overnight so analysts have clean inputs at the start of each business day.
- Separate hot path and cold path flows. Real-time signals and historical backtesting must run on separate architectures. Mixing them degrades performance and introduces latency into time-sensitive decisions.
- Add checkpoints at every stage. Each transformation step should write a validation log. If a data source goes down or a schema changes, the pipeline fails loudly rather than silently producing bad numbers.
- Orchestrate with Apache Airflow. Define each pipeline stage as a directed acyclic graph (DAG) in Airflow. This gives you dependency management, retry logic, and a visual audit trail.
- Test before promoting to production. Run the full pipeline against a historical date range before scheduling it live. Confirm that row counts, null rates, and key metrics match expected ranges.
Key scheduling best practices to follow:
- Run ingestion jobs during off-peak hours to avoid API rate limits
- Set alerting on pipeline failures so you know before the market opens
- Store raw source data before transformation so you can reprocess if logic changes
- Document every data source, refresh frequency, and schema version in a shared catalog
A well-built automated pipeline is not a luxury for large teams. Even a solo analyst covering a single asset class benefits from the consistency and time savings that scheduled automation provides.
What are the most common mistakes in market data workflows?
Even experienced analysts repeat the same errors. Knowing where workflows break down is half the defense against it.
- Skipping problem definition. Nearly 40% of market analysis project errors trace back to inadequate data cleaning and unclear problem scope. A vague brief produces a vague result, no matter how sophisticated the model.
- Ignoring look-ahead bias. Point-in-time discipline means your backtest uses only data that was available at the historical moment being simulated. Using revised or restated data introduces future information and makes strategies look far better than they perform live.
- Treating dashboards as analysis. A dashboard is a communication tool. The real insight comes from EDA performed before any chart is built. Analysts who skip EDA and go straight to visualization routinely miss distributional anomalies and structural breaks.
- Testing in a single market regime. Rigorous statistical testing across multiple regimes, including bull markets, bear markets, and high-volatility periods, is the only way to confirm that a signal is not regime-specific. A strategy that works only in low-volatility environments is not a strategy.
- Starting with expensive primary data. Build your baseline from free secondary sources like FRED, BLS, and EDGAR before spending on proprietary data feeds. Fill gaps with primary research only when secondary sources cannot answer the question.
“The most dangerous number in market analysis is one that looks right but has never been stress-tested. Build validation into every step, not just the final output.”
The day trading systematic workflow community has documented many of these pitfalls in detail, and the lessons apply equally to longer-horizon institutional analysis.
Key Takeaways
A well-structured market data analysis workflow reduces errors, saves time, and produces results that hold up under scrutiny across asset classes and market conditions.
| Point | Details |
|---|---|
| Define objectives first | Write a single-sentence problem statement before touching any data to prevent scope creep. |
| Automate cleaning early | Data cleaning takes up to 80% of project time; automating it with dbt Core prevents repeated rework. |
| Separate hot and cold paths | Real-time and historical data flows need distinct architectures to maintain speed and accuracy. |
| Validate across regimes | Test signals in bull, bear, and high-volatility periods to confirm robustness before going live. |
| Use secondary data first | FRED, BLS, and EDGAR provide cost-free baselines; add primary data only to fill specific gaps. |
Why most workflow failures are really objective failures
We have worked with analysts across equities, fixed income, and crypto who built technically sound pipelines that still delivered poor results. In almost every case, the root cause was not a bad model or a broken tool. It was an objective that was never clearly defined at the start.
AI tools like DataToBrief have changed the speed equation dramatically. AI-augmented research systems can cut analyst effort by roughly 95–97% per briefing, compressing 6–8 hours of manual work into 10–15 minutes. That is genuinely useful. But speed amplifies both good and bad process. A fast workflow built on a vague question produces wrong answers faster.
The analysts who get the most from automation are the ones who treat the objective-setting phase as non-negotiable. They write the question down. They get stakeholder sign-off before the first API call. They define what “done” looks like before the pipeline runs.
The other lesson we keep relearning is that real-time market data and historical data serve different cognitive purposes. Real-time data tells you what is happening now. Historical data tells you what patterns have held and under what conditions. Mixing them in the same analytical frame without architectural separation is a recipe for confusion. Keeping them distinct, both in your pipeline and in your thinking, produces cleaner, more defensible conclusions.
Build the workflow first. Let the tools serve it.
Take your market monitoring further with Handy.Markets
A solid data analysis process gives you the framework. Real-time alerts give you the trigger to act on it.
Handy aggregates live prices across cryptocurrencies, stocks, commodities, forex, and indices in one place, so you never have to switch between platforms mid-analysis. You can set up price alerts in minutes across Telegram, Discord, Slack, SMS, Webhook, and Email, connecting your workflow directly to the market signals that matter most. Whether you are monitoring a DeFi position or tracking a macro indicator, Handy keeps you informed without adding noise. Explore the full markets dashboard to see live data across every asset class your workflow covers.
FAQ
What is a workflow for market data analysis?
A market data analysis workflow is a structured, repeatable sequence of steps covering data collection, cleaning, analysis, validation, and interpretation. It gives analysts a consistent process for turning raw financial data into reliable insights.
How long does a typical market data analysis process take?
Manual workflows can take 6–8 hours per briefing cycle. AI-augmented pipelines using tools like DataToBrief reduce that to 10–15 minutes for standard research tasks.
What tools are used in a market analysis workflow?
Common tools include Apache Airflow for orchestration, dbt Core for data transformation, PostgreSQL for storage, and Metabase for visualization. Python libraries like pandas and statsmodels handle statistical analysis at each stage.
What is look-ahead bias and why does it matter?
Look-ahead bias occurs when a backtest uses data that was not available at the historical moment being simulated. It produces overly optimistic results that fail in live trading because the model was trained on information it could not have had.
How do I know if my market data workflow is working?
A working workflow produces consistent, reproducible results across multiple runs and market regimes. Validation logs, out-of-sample testing, and documented data lineage are the three clearest indicators that your process is production-ready.