Market swings can feel like the ground shifting beneath your portfolio, and without the right framework, even experienced traders get caught off guard. Whether you’re watching crypto spike 20% overnight or a commodity index quietly erode over weeks, the ability to read and respond to fluctuations separates reactive traders from confident ones. This guide walks you through the core methodologies, practical tools, and step-by-step processes for analyzing market fluctuations across asset classes. We’ll cover key volatility measures including VIX, GARCH models, and cyclic analysis, so you can turn market noise into actionable signals.
Table of Contents
- What you need to analyze market fluctuations
- Step-by-step guide: Core methodologies for fluctuation analysis
- Volatility benchmarks and interpreting market signals
- Integrated approaches: Avoiding common mistakes and adapting to market regimes
- Monitor market fluctuations and set price alerts with Handy.Markets
- Frequently asked questions
Key Takeaways
| Point | Details |
|---|---|
| Combine multiple methods | Integrated analysis with volatility, cyclic, and sentiment tools yields more reliable insights. |
| Know regime shifts | Recognizing trending versus mean-reverting periods is crucial for adapting trading strategies. |
| Statistical validation matters | Always validate cycles and signals to avoid costly mistakes from noise and false patterns. |
| Use real-time monitoring | Set up market alerts to react promptly to swings and protect your portfolio. |
What you need to analyze market fluctuations
Having set the stage for why fluctuation analysis matters, let’s clarify what you need to get started. Before running any analysis, you need two foundational inputs: reliable price data and the right analytic tools. Skipping either one is like trying to navigate without a map.
On the data side, you need both historical price data (at least 2 to 5 years for meaningful cycle detection) and real-time feeds for live decision-making. Most serious traders pull data from exchange APIs, financial data providers, or platforms that aggregate multiple asset classes in one place. Pairing that with essential stock indicators gives you a solid analytical foundation.
Here’s a quick comparison of the primary analytic approaches:
| Method | Best for | Data required | Complexity |
|---|---|---|---|
| VIX | Implied volatility, sentiment | Options market data | Low |
| GARCH model | Volatility forecasting | Historical price returns | Medium |
| Cyclic/spectral analysis | Pattern detection, timing | Long historical series | High |
| Hurst exponent | Regime classification | Price time series | Medium |
The primary analytic methodologies include VIX for implied volatility, GARCH for forecasting, and cyclic or spectral models for identifying repeating patterns. Each serves a different purpose, and the strongest analysis combines at least two.
Here’s what you need to get set up:
- Price data feeds: Real-time and historical data for your target asset classes
- Statistical software: Python (with pandas, statsmodels), R, or dedicated platforms
- Volatility tools: Access to VIX data, options chains, or volatility indices
- Cycle analysis tools: Goertzel algorithm implementations or platforms supporting cyclic analysis
- Timeframes: Match your timeframe to your strategy (intraday, swing, or position trading)
For a broader view of how these tools fit together, the understanding market fluctuations guide is a great companion resource.
Step-by-step guide: Core methodologies for fluctuation analysis
With your tools and data in place, here is a structured process for fluctuation analysis. Think of this as your repeatable workflow, not a one-time exercise.
Step 1: Detrend your price data. Remove the long-term trend so you can isolate cyclical movements. Without this step, your cycle detection will pick up trend noise instead of genuine patterns.
Step 2: Run spectral analysis. Apply the Goertzel algorithm to identify dominant cycle lengths in the detrended data. This surfaces repeating rhythms that aren’t visible on a standard price chart.
Step 3: Validate statistically. Use the Bartels test to confirm that detected cycles are statistically significant, not just random noise. The core cyclic analysis steps include detrending, spectral analysis, Bartels validation, and composite waveform construction.
Step 4: Build a composite waveform. Combine validated cycles into a single projection model. This gives you a forward-looking view of likely price rhythm.
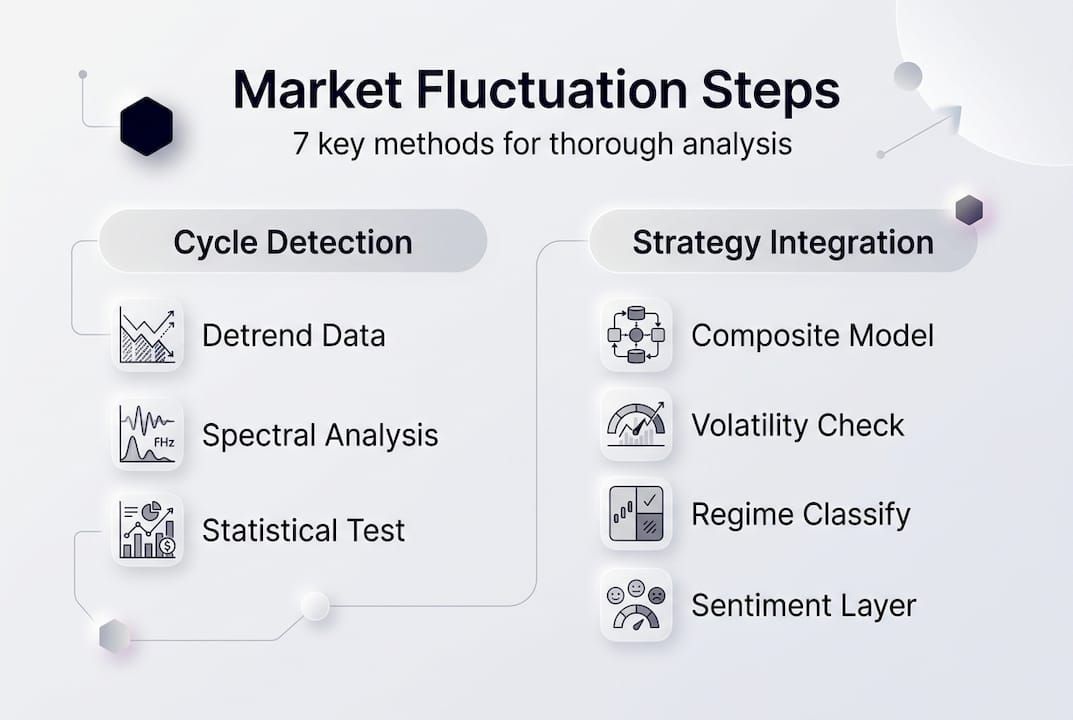
Step 5: Layer in volatility analysis. Check the VIX indicator for implied volatility, calculate historical volatility using standard deviation, and apply GARCH if you need a volatility forecast. Use the volatility checklist for traders to make sure you’re not missing a step.
Step 6: Classify the market regime. Use the Hurst exponent to determine whether the market is trending (H above 0.5) or mean-reverting (H below 0.5). This shapes which tools you lean on most.
Step 7: Integrate sentiment. Tools like BERT-based sentiment models can flag when crowd psychology is amplifying or suppressing price moves. This is especially useful during earnings seasons or macro announcements.
Pro Tip: Always validate your detected cycles statistically before acting on them. Overfitting to noise is one of the most common and costly mistakes in cyclic analysis. If a cycle doesn’t pass the Bartels test, treat it as unconfirmed.
For a deeper look at managing volatility within your strategy, the volatility guide for investors breaks down practical approaches for different risk profiles.
Volatility benchmarks and interpreting market signals
Once you’ve run your analysis, interpreting the outputs, especially volatility signals and benchmarks, is crucial for trading decisions. Raw numbers mean nothing without context.
The VIX is the market’s most-watched fear gauge. Here’s how to read it:
- VIX below 15: Markets are calm. Complacency can be a risk here.
- VIX between 15 and 25: Normal operating range. Moderate uncertainty.
- VIX between 25 and 30: Elevated anxiety. Traders are pricing in risk.
- VIX above 30: High fear and uncertainty. Crisis conditions are possible.
- VIX above 80: Extreme panic. During COVID-19 in March 2020, the VIX briefly hit 82.69, a level not seen since the 2008 financial crisis.
That COVID spike is a perfect example of a crisis regime, where normal cycle patterns break down and volatility models need to shift. Crisis regimes suspend normal cycles, and choppy regimes with conflicting signals reduce projection reliability significantly.
Here’s a comparison of normal versus crisis market conditions:
| Factor | Normal regime | Crisis regime |
|---|---|---|
| VIX range | 12 to 25 | 30 and above |
| Cycle reliability | High | Low |
| Best model | Cyclic or GARCH | GARCH preferred |
| Sentiment role | Secondary | Primary driver |
| Correlation behavior | Stable | Breaks down |
Practical tips for interpreting volatility signals:
- Compare implied volatility (VIX, options pricing) against historical volatility (standard deviation of returns) to spot mispricings
- Watch for VIX divergence from price action, it often signals a coming reversal
- Use volatility indicators alongside price charts, not in isolation
- Adjust position sizing when VIX spikes above 25, risk is elevated across all asset classes
For a fuller picture of how volatility shapes investment decisions, volatility in investing is worth reading alongside this guide.
Integrated approaches: Avoiding common mistakes and adapting to market regimes
With your interpretation skills sharpened, it’s important to integrate several approaches and adapt to shifting market conditions. No single method works in every environment.
The Hurst exponent for regime detection is one of the most underused tools in retail trading. An H value above 0.5 signals a trending market where momentum strategies work well. Below 0.5 points to mean-reversion, where fading extremes becomes more reliable. Ignoring regime classification is one of the fastest ways to apply the right tool in the wrong environment.
Here are the best practices for multi-timeframe, integrated analysis:
- Classify the regime first. Before choosing your strategy, determine whether the market is trending, ranging, or in crisis mode.
- Combine macro, sentiment, and technical signals. Statistical validation combined with macro and sentiment factors produces far more robust analysis than any single input.
- Use multiple timeframes. A cycle visible on a weekly chart may not appear on a daily chart. Cross-reference to confirm.
- Set rules for regime transitions. When the Hurst exponent shifts or VIX crosses a threshold, have a predefined response plan. The market monitoring guide covers how to set up alerts for exactly these moments.
- Review and recalibrate regularly. Markets evolve. A model that worked in 2024 may need adjustment in 2026 as liquidity conditions and correlations shift.
Pro Tip: Adapt your primary method based on regime classification. In trending markets, lean on GARCH and momentum signals. In mean-reverting markets, cyclic analysis and contrarian sentiment become more valuable. Mixing methods without regime awareness leads to conflicting signals.
“The riskiest thing in the world is the belief that there’s no risk.” Howard Marks has long argued that volatility itself is not risk. True risk is permanent loss of capital, and confusing the two leads traders to make fear-driven decisions at exactly the wrong moment.
For building a complete strategy around these principles, mastering market trends and top investment strategies offer practical frameworks. And if you want to stay current on how data and tools are evolving, market data trends in 2026 is a useful read.
Monitor market fluctuations and set price alerts with Handy.Markets
Now that you have a robust approach to market fluctuation analysis, the next step is putting it into practice with tools that keep you informed in real time. Analysis is only as good as the data feeding it.
Handy.Markets aggregates live prices, percentage changes, and volatility signals across cryptocurrencies, stocks, commodities, indices, and forex, all in one place. You can personalize your market view to focus on the assets that matter most to your strategy. What makes it especially useful is the price alert system, which lets you set threshold notifications across Telegram, Discord, Slack, SMS, Webhook, and Email. Whether you’re tracking a VIX spike or watching a crypto price move develop, you’ll get notified the moment it matters, without having to stare at charts all day.
FAQ
What is the best indicator for market fluctuations?
The VIX index is the most widely used measure of implied volatility, while GARCH models and cyclic analysis add forecasting depth and pattern recognition to your toolkit.
How do I detect market regimes for analysis?
Market regime detection relies on the Hurst exponent and sentiment tools like BERT to classify whether a market is trending or mean-reverting, which then guides your choice of analytic method.
How can I avoid false cycle detection in analysis?
Always run statistical validation using the Bartels test on any detected cycle, and cross-check findings against macro context and sentiment data before acting on them.
Is volatility the same as risk?
No. Volatility measures price movement, but risk encompasses permanent capital loss, drawdown probability, and strategy-specific factors that vary widely across assets and timeframes.